
2020 has been a year of unprecedented growth for ecommerce businesses. With 2020 ecommerce sales projected to exceed the $4 trillion mark, and many businesses switching to online during the pandemic, the ecommerce market is more overcrowded than ever.
This puts the ecommerce entry bar at its highest and pushes existing ecommerce business owners into entering a challenging race. As the average 2020 traffic growth to ecommerce sites reaches 30%, industry players are looking for opportunities to get a share of this ecommerce boom and strengthen their market positions.
While traditional generic tips for growing an ecommerce business are still valid, to benefit from this online shopping bonanza, they should look for more tailored solutions to growing market share.
For this, Semrush has analyzed the latest ecommerce trends, focusing on channels and tactics that drive growth in the US market. Based on insights from the three winning ecommerce categories and brands within each group, this post reveals:
- the key traffic drivers for the fastest-growing ecommerce players;
- their current market positions, growth trends, and conversion rate estimates; and
- tips on how to grow traffic within the new ecommerce market realities.
The Fastest-Growing Ecommerce Categories in 2020
With global “buy online” searches soaring this year, some ecommerce categories have been benefiting from the global lockdowns and pandemic-related measures, despite the high economic uncertainty and volatile consumer confidence.
Focussing our attention on the US ecommerce market’s biggest winners, with the help of Semrush’s Traffic Analytics, we managed to identify the three categories that are showing the fastest market growth in the region this year:
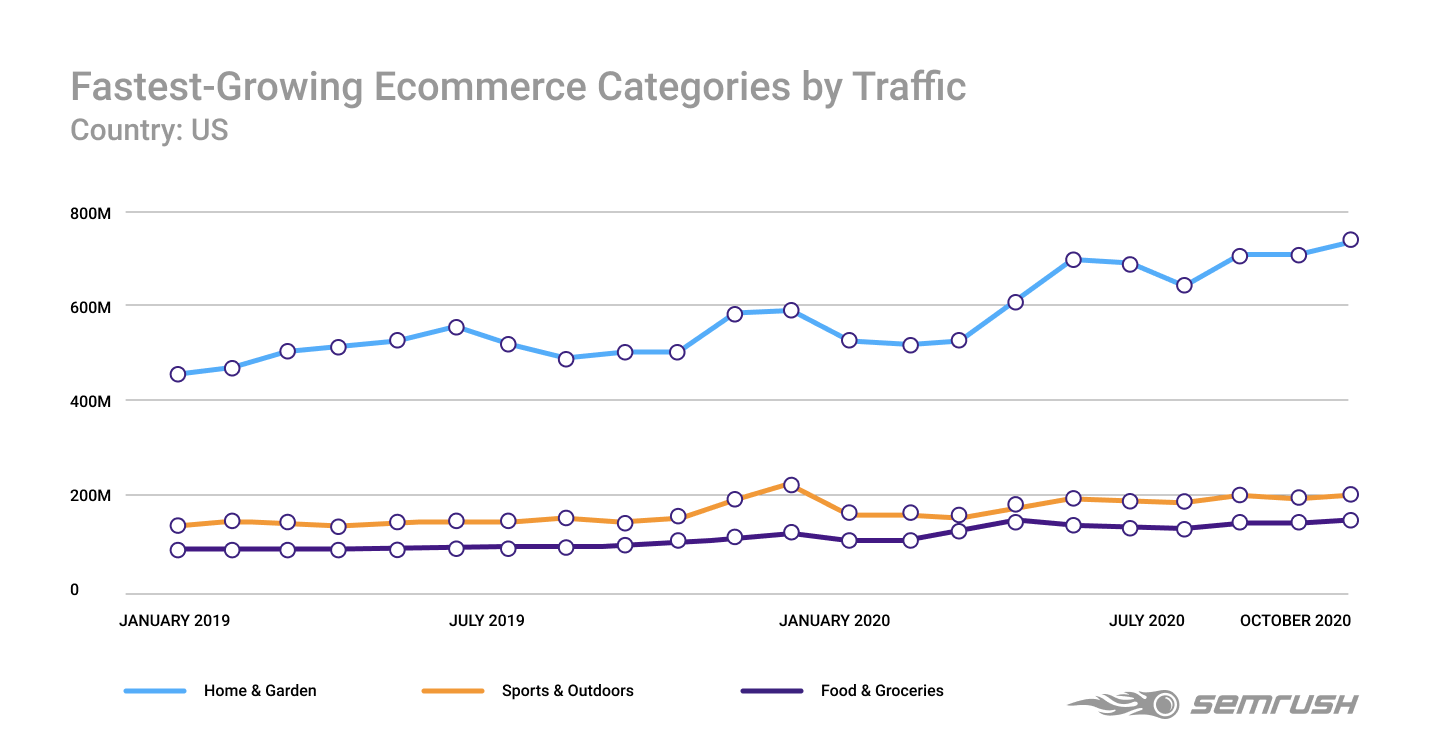
With average annual traffic counts rising by 30%, Home & Garden, Food & Groceries, and Sports & Outdoors are the top-3 fastest-growing ecommerce categories in 2020.
Clearly, the global pandemic has played a big role in their growth — all the WFH, shelter-in-place and lockdown orders were (and still are) boosting demand for products within each category.
However, after deep-diving into each category, we managed to spot that this growth trend is in place from year to year, and so it’s worth dissecting how these top categories manage to always take the lead across the ecommerce market.
Fastest-Growing Brands Within Top Ecommerce Categories
Before exploring each category’s precise traffic-generation strategies, we wanted to see the key players within each category in the US, as well as analyze any shifts in visitor count trends and market positions of the category leaders.
Total Market Trends For All Categories: Growth and Strong Traffic Seasonality
Analyzing the three-year traffic volumes for all three ecommerce niches, we can see a strong growth trend that only accelerated with the pandemic.
Following the market demand logic, we also spotted the traditional traffic seasonality, with higher site visitor counts during the biggest winter shopping season, which starts in October and creeps all the way into December.
The second wave of Covid and reluctance of some Governments to continue with stimulus checks does not seem to have had an impact on consumers’ online buying behavior.

YoY Traffic Shifts Across Top Market Players
Within the fastest-growing ecommerce niche, Home & Garden, the top 5 consists of familiar big box stores like Home Depot, Lowe’s, and Menards. However, the most rapid traffic growth — of over 50% — occurs across the largest US-based purely online furniture sellers — Wayfair and Houzz.
Home & Garden
| Position |
Domain |
Average monthly traffic 2019 |
Average monthly traffic 2020 |
Change |
|
1 |
234.7M |
336.4M |
43% |
|
|
2 |
146.6M |
191.2M |
30% |
|
|
3 |
96.1M |
150.1M |
56% |
|
|
4 |
28.3M |
34.1M |
20% |
|
|
5 |
18.2M |
27.6M |
52% |
In the Food & Groceries sector, Instacart is the absolute category winner in terms of rapid growth, with over 100% YoY (2019 vs. 2020) traffic increase. Benefiting from incredible consumer growth during the pandemic, which raised the company’s valuation from $17 billion to $30 billion in a single month, the food delivery brand is aiming to go for a big-shot IPO.
Food & Groceries
| Position |
Domain |
Average monthly traffic 2019 |
Average monthly traffic 2020 |
Change |
|
1 |
32.6M |
38.5M |
18% |
|
|
2 |
11.4M |
23.2M |
103% |
|
|
3 |
9.7M |
13.4M |
37% |
|
|
4 |
9.5M |
13M |
37% |
|
|
5 |
6.3M |
10.5M |
67% |
The Sports & Outdoors fastest-growing companies have mostly to do with sports outfits and gear. Despite gyms closing down across many parts of the world, pandemic-time consumers moved their sports activities outdoors or purchased sports gear for some in-house action, looking for ways to leave the house and keep up with their healthy routine.
Although Nike, the category traffic leader, is not growing at the same pace as others, its closest competitor, Rei, is 52% behind the brand that ‘just does it’ — i.e. wins traffic and keeps growing.
Sports & Outdoors
| Position |
Domain |
Average monthly traffic 2019 |
Average monthly traffic 2020 |
Change |
|
1 |
40.5M |
47.1M |
16% |
|
|
2 |
18M |
22.6M |
26% |
|
|
3 |
17.6M |
21.3M |
21% |
|
|
4 |
14.7M |
19.3M |
31% |
|
|
5 |
9.5M |
10.1M |
5% |
YoY Market Position Shifts Across the Top Players
While with the Home & Garden category, things seem to be quite still, the fastest-growing players within the Food & Groceries and Sports & Outdoors niches have seen some YoY online market share fluctuations.
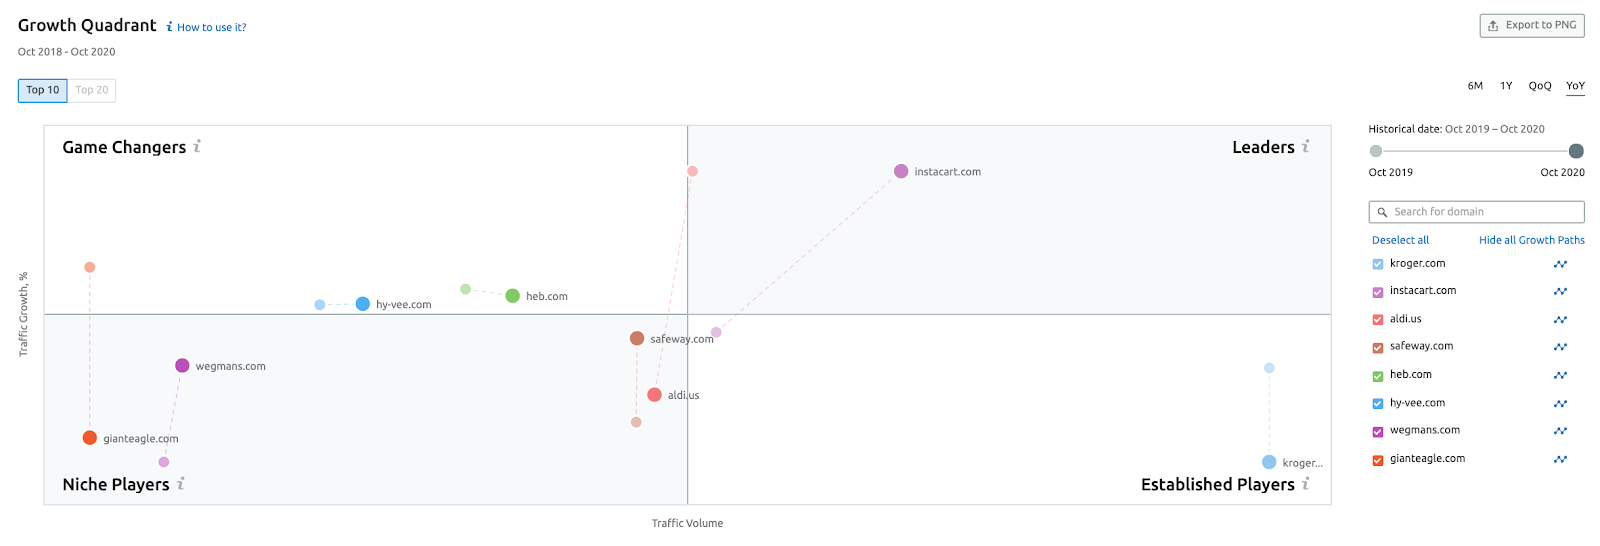
The Market Explorer tool features a Growth Quadrant, a widget that classifies key market players across four categories:
-
Leaders (large online audience + high growth rate);
-
Established Players (large online audience + lower growth rate);
-
Niche Players (lower online audience + lower growth rate); and
-
Game Changers (lower online audience + high growth rate).
Looking at the online market performance of rapidly growing brands within the Food & Groceries sector, we can see that the previously mentioned Instacart has moved from a niche player spot into the market leader.
In 2020, Kroger has only strengthened its market position as an established player, while Aldi’s growth pace seems to have slowed down. Heb, with its lowest audience numbers among the fastest-growing players, remains a game-changer.
Food & Groceries
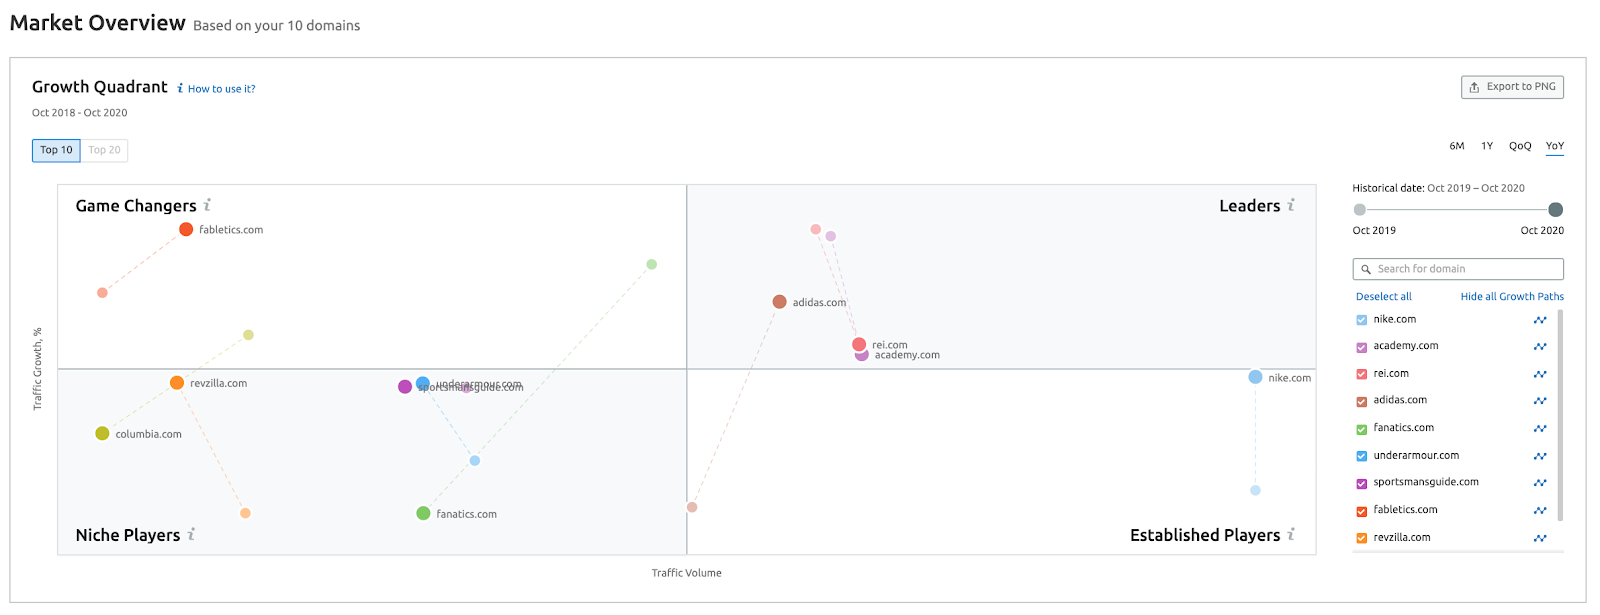
Within the Sports & Outdoors sector, Adidas, thanks to a pretty high growth rate in 2020, has reached a market leader position.
However, according to insights from the Growth Quadrant, Adidas has plenty of brands to watch out for as Nike is now also becoming a market leader, along with Rei and Academy brands also staying within the leading spots.
Sports & Outdoors
Ecommerce Best Practices: How do the fastest-growing categories drive traffic?
Now that we’ve gathered an overview of the market landscape of the fastest-growing companies across each ecommerce category, it’s finally time to uncover how they manage to get ahead of the competition and ensure high traffic growth rates from year to year.
The Market Explorer tool brings insights into these categories’ traffic-generation strategies, with a detailed breakdown of each channel.
There are recurring trends across all the fastest-growing ecommerce categories:
- The majority of site visitors for the three categories come from direct searches. While over 65% of food and grocery online shoppers know the brand they are willing to purchase from, in the Home & Garden and Sports & Outdoors categories, direct search visitors account for around 50% of total traffic.
- Around 20% of the audience prefers to surf the web in search of a brand that can satisfy their Home & Garden, Food & Grocery, and Sports & Outdoors needs, making search traffic the second-most important source of site visits.
- Referral traffic is the third most popular traffic source across the three sectors, with an average of 12% of site visitors coming from referrals.
Leveraging the Key Traffic Drivers for Ecommerce Growth
Growing Traffic from Direct Search
Our ecommerce winners getting //earning their biggest share of visitors from direct traffic implies that they have both high brand awareness and customer loyalty.
Thus, the key to driving more visitors who directly type your site into the URL box is to amplify your brand and ensure high customer retention.
However, building a strong brand and encouraging customer loyalty is not a fast process, and you need to make sure to:
- Invest in brand recognition: Whether online or offline, brand marketing campaigns are one of the few ways to boost brand awareness and drive direct traffic. Some forms of advertisement like YouTube display ads or billboards are designed for brand recognition growth.
- Strengthen brand loyalty: Brands often employ loyalty programs and special deals for next purchases to encourage return visits. But pay attention to things like site UX and a smooth online buying experience, because if customers find your site inconvenient or slow, they will likely look for other options and brands.
Driving Visits from the Search Engines
Before diving into SEO optimization specifics for ecommerce sites, we have to break the news about the upcoming Mobile index 2021 update, which essentially means “zero desktop content”.
While the “mobile optimization is the key” mantra is nothing new, especially to ecommerce business owners, soon desktop-only sites will be completely removed from Google rankings. So, now, more than ever, mobile optimization is key.
The standard SEO logic is even stronger when it comes to driving visits from the search engines to your ecommerce site. From keyword research and mapping and on-page/off-page SEO to technical SEO and site architecture, these steps should be totally covered within your SEO strategy if you want to get a fair share of visits from the search engines.
However, things like site load speed, an HTTPS safety certificate, and a smooth checkout process are more important for ecommerce sites than for any others.
Since SEO is a comprehensive topic to cover in a few sentences, make sure to read our definitive guide to ecommerce SEO for 2020.
Using Referrals to Get More Visitors
When thinking about referral traffic, you may immediately imagine a large influencer campaign and brand ambassador or affiliate program. These tactics are definitely an option, even a great option if you manage to find the right influencers and fine-tune your affiliate strategy.
However, to avoid any pitfalls that may come from relying on others for your referral success, you can instead invest in an internal referral program.
Launch an internal referral program
To continue with our Sports & Outdoors theme, let’s look at one of the smartest internal referral programs within the niche.
The Clymb offers a reward to any user who buys something priced over $50 in the form of credit which the user can both put towards their next purchase and share with a friend.
Thus, The Clymb’s reward program entices shoppers not only to refer their friends to the brand but also to make return purchases.
Find the best media placements
Thinking outside of traditional referral programs, content placement can also be a great source of referral traffic.
On a basic level, you can simply find relevant discussion forums or go through Quora questions and pitch in if you have something to add to the discussion and can seamlessly integrate a link to your site into the answer.
For a more high-level approach, you can make data-driven decisions when deciding on placements for your external content.
With the help of the Traffic Analytics tool, you can uncover which blogs and online publications are frequently visited by your target audience and make content placements in more relevant platforms that have higher traffic-driving potential:
- Enter your site and your potential publishers’ sites into the Traffic Analytics tool.
- Find publishers that have the highest unique audience numbers to approach new potential buyers and expand your brand’s reach.
- Additionally, explore the online platforms with the biggest share of an audience similar to yours to get extra visibility and encourage more touchpoints with potential customers.
Top Social Media Channels for the Three Rapidly Growing Ecommerce Categories
While social media brings comparably less traffic than other channels to our three ecommerce categories, there are some interesting specificities across the social platforms that drive the most traffic.
-
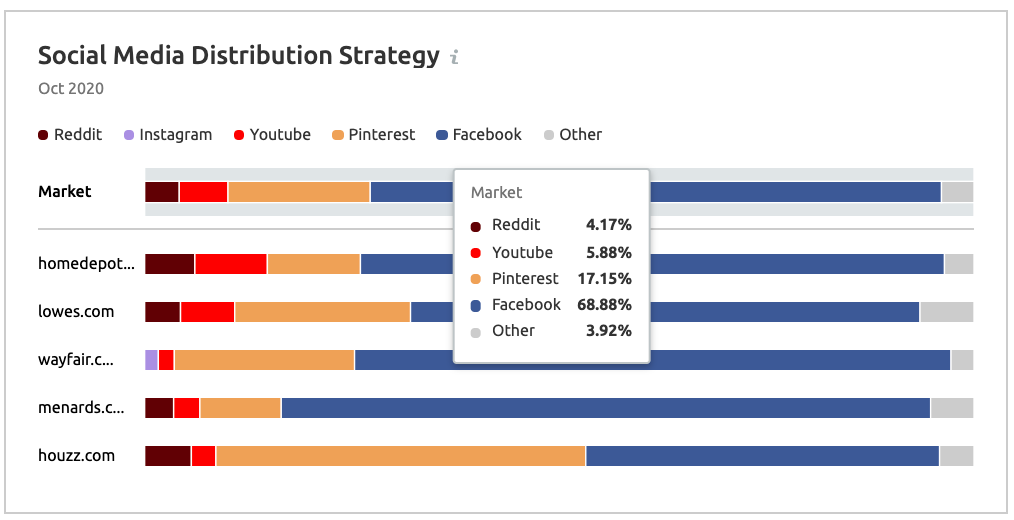
Within the Home & Garden niche, Pinterest is bringing an unusually high share of visitors from social media. This is not all that surprising as Pinterest actually has a rapidly growing audience of 400 million users, and is inherently a visuals-driven platform, which is perfect for showcasing home and garden decoration.
Home & Garden
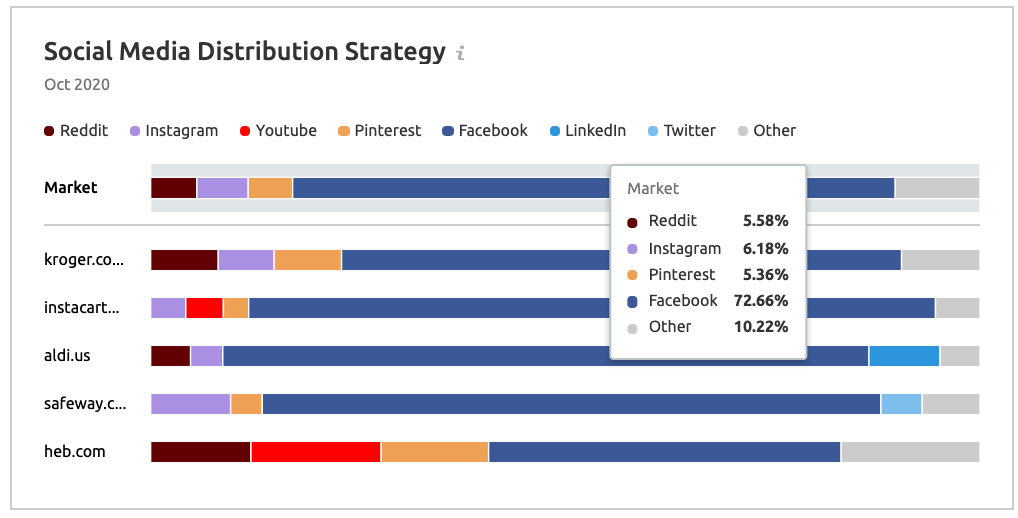
 In the Food & Groceries sector, Facebook is the absolute leader when it comes to driving traffic. The social network brings over 70% of social media visits for ecommerce brands within the category.
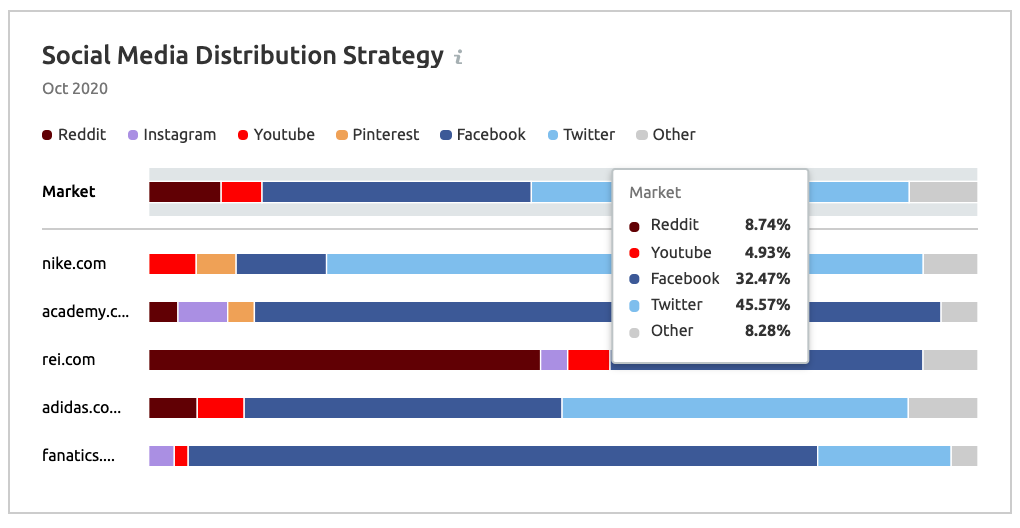
 Looking at the Sports & Outdoors social media landscape, Twitter surpasses the impact of Facebook, driving over 45% of visitors. We didn’t expect to see Reddit winning over YouTube within this category, but the former brings double the traffic of the latter.
Sports & Outdoors
Gathering Audience Insights to Leverage the Power of Social
While it’s important to explore which social media platforms bring the highest visitor numbers to key market players and competing brands, it may be even more useful to understand what kinds of audiences they are targeting.
Armed with insights from our Market Explorer tool, we can take a sneak peek into the key characteristics of the Home & Garden niche audience:
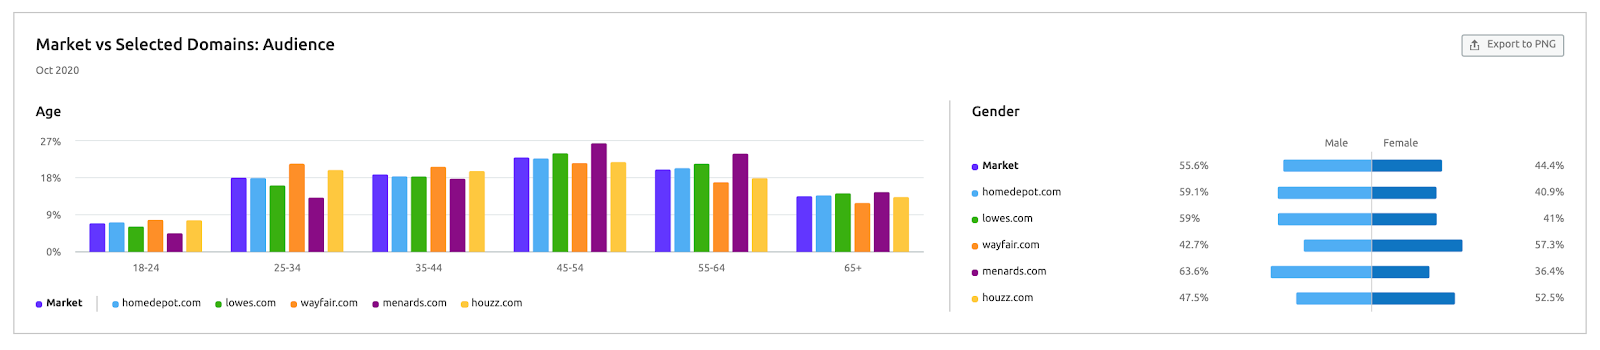
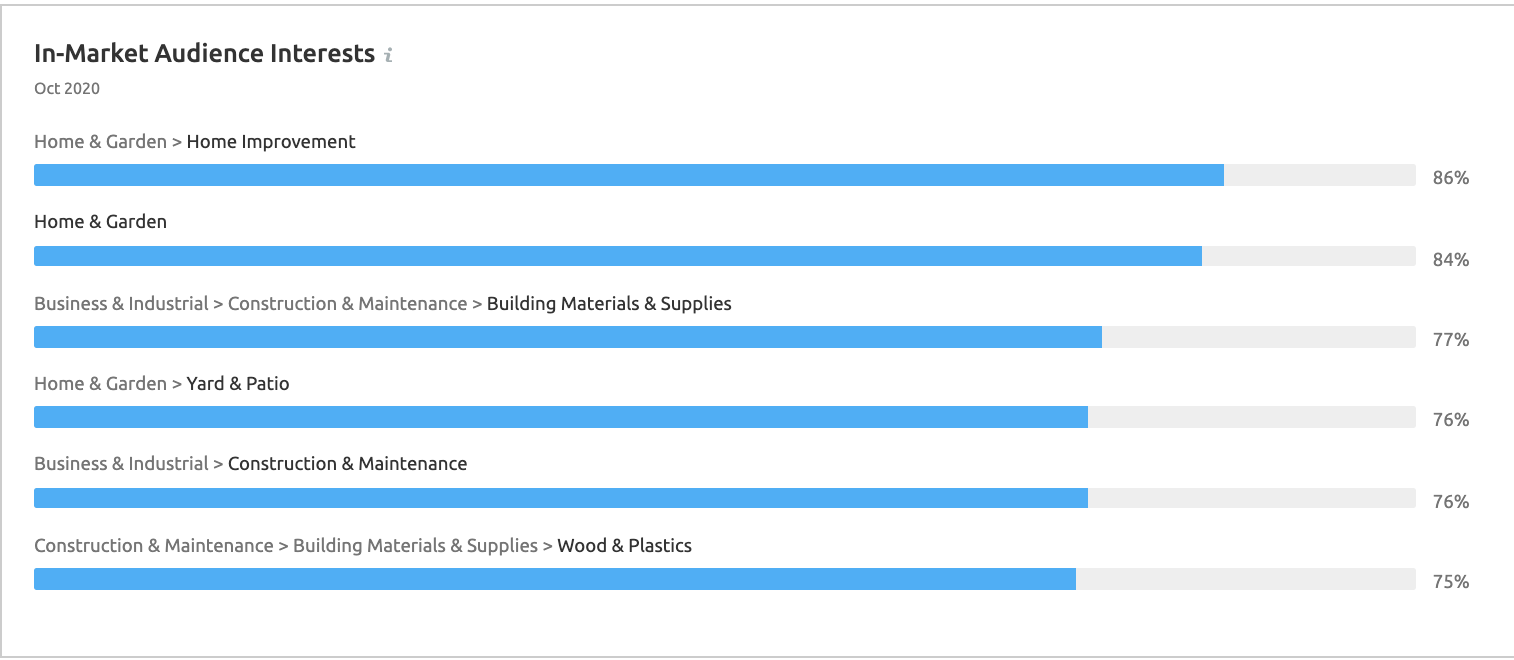 The tool reveals that if running an ecommerce business whose key competitor is Wayfair, it would make sense to create social media ad campaigns and set targeting to 25-54-year-old females interested in home improvement, home and garden, and building materials.
Bonus: Estimating Ecommerce Winners’ Conversion Rates
We have to emphasize that traffic counts is only a part of these brands’ success stories.
While you may manage to bring in as much traffic as your key competitors, you have to also see if their audience actually converts into paying customers, thus measuring the quality and real business impact of their growth.
Conversion rate data is one of the most well-hidden things within competitor and market analysis, yet there is a certain workaround we’d like to share:
- Using Traffic Analytics’ Top Pages report, you can get an estimate on any site’s unique pageviews and unique visitors data.
- Then, you can cross-compare the estimated number of unique visitors to the site’s main page against the traffic volume for pages related to “payment”, filtering the list by “pay”/”checkout”/”thank-you” terms.
- Using similar logic, you can filter the pages by other conversion actions of your interest — log-ins, sign-ups, and more.
- Keep in mind that absolute traffic and unique visitor numbers are not important here, what you need is to understand percentage points for competitors’ conversion rates.
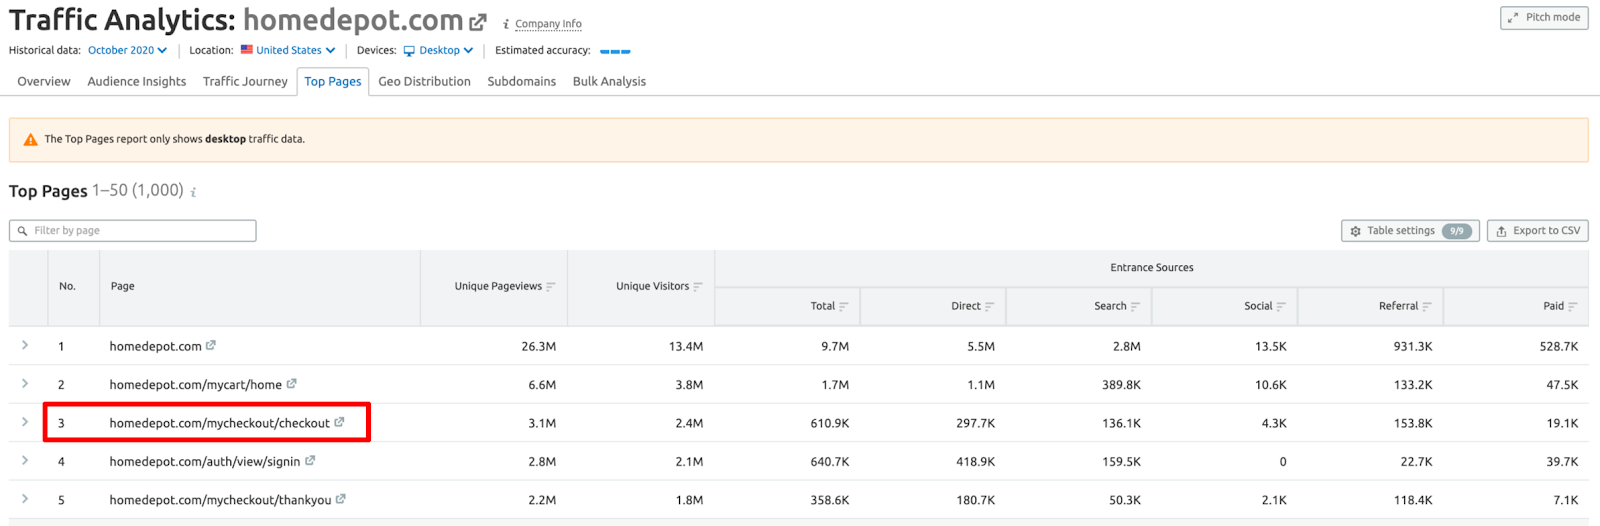
We used this approach for a conversion rate estimate for Home Depot, Lowe’s, and Houzz.
| Domain |
Average CR 2019 |
Average CR 2020 |
Change |
|
homedepot.com |
3.93% |
7.90% |
3.97% |
|
houzz.com |
0.67% |
0.51% |
-0.16% |
|
lowes.com |
2.19% |
5.89% |
3.71% |
Despite their high growth speed, the three brands managed to attract an even more targeted audience that is more willing to make a purchase, implying laser-focused and high-impact traffic growth efforts.
Now, we hope that equipped with our analysis of the key traffic drivers for the fastest-growing ecommerce companies, as well as a pro tip on taking a sneak peek at competitors’ conversion rates, you can replicate this process to discover traffic channels that make-it-or-break-it within your particular niche.