
What Is Google PageSpeed Insights?
Google PageSpeed Insights (PSI) is a popular, free tool that analyzes the page speed of a website on mobile and desktop devices.
It gives you a score between 0 and 100. A higher score would usually mean your website is optimized for speed and efficiency. Then, it provides suggestions on how to improve.
Want to use Google PageSpeed insights like a pro and get as close as possible to 100/100? You’re in the right place.
How to Use the Google PageSpeed Insights Tool
PageSpeed Insights is pretty easy to use.
- Just go to Google Page Speed Insights, enter any URL (whether it’s your own or a competitor’s), and click “Analyze:”

- Then, wait for the tool to analyze the webpage. This may take a few seconds to a minute, depending on the complexity of the page and your internet connection speed.
- Once the analysis is complete, you will see a score for both mobile and desktop versions of the webpage, ranging from 0 to 100. You will also see a list of opportunities to improve the page’s performance.

- Review the opportunities. For each opportunity Google suggests, you can see the estimated time savings in seconds. This helps you estimate the expected impact of implementing the suggestion. Use this information and the expected difficulty to prioritize the opportunities.

- Implement the optimization suggestions on your website, and then rerun the analysis to see if the changes have improved the page’s performance. Sometimes, you can run your website twice without making any changes and get a different score, so it’s worth running the analysis twice at different times of the day.
Running the analysis is simple enough. The key thing is understanding the metrics and implementing the recommendations.
Understanding the PageSpeed Insights Report
Some of the language in the PageSpeed Insights report is quite technical. But don’t worry—it’s not as complicated as it might seem at first glance.
Let’s dive into the three main sections of the report.
Core Web Vitals Assessment

At the top, it will say Core Web Vitals assessment “Passed” or “Failed.” Core Web Vitals are metrics Google uses as key ranking factors on mobile:
- Largest Contentful Paint (LCP): Measures loading performance, specifically the time it takes for the largest piece of page content to become visible to the user.
- Cumulative Layout Shift (CLS): Measures visual stability, specifically how much the page content moves around as it loads.
- First Input Delay (FID): Measures interactivity, specifically the time it takes for the website to respond to the first user interaction, such as clicking a button or a link. (This will be replaced in March 2024 by Interaction to Next Paint (INP).)
Diagnose Performance Issues

Underneath Core Web Vitals assessment, in the section titled “Diagnose performance issues,” you will find a “Performance score.”
Google PageSpeed Insights gives your page a score for each of the following categories:
- Performance: This is your overall score. It indicates how well your page performs in terms of speed and optimization.
- Accessibility: This category assesses factors such as ease of navigation, alt text for images, and color contrast for users with visual impairments
- Best Practices: The Best Practices category measures how well your page adheres to web development best practices. Like using modern web technologies, optimized code, and secure connections.
- SEO (Search Engine Optimization): This category focuses on how well your page is optimized for search engines, considering aspects such as metadata, structured data, and mobile-friendliness.
Opportunities
Underneath the Core Web Vitals assessment and “Diagnose performance issues” sections, you will find a list of items called “Opportunities.” These are Google’s recommendations for improving your site. That could be optimizing images, simplifying code, or reducing server response time.
You can use this information to boost the speed and efficiency of your site. This is beneficial for user experience and your search engine rankings.
What Is a Good PageSpeed Insights Score?
In theory, the highest possible score is 100/100. According to Google, a score of 90 or above is good, 50 to 89 needs improvement, and below 50 is considered poor.

If your score is below 90, it’s possible that your users are not having a good experience. And there may be some negative SEO effects of having a poor user experience.
The good news: Google gives you a bunch of recommendations on how to improve.
But keep this in mind:
If your score is above 90, you can always improve, but it might not be worth the effort.
Even Google’s own website scores below 100. So, it’s probably not worth obsessing too much about reaching the top score. The return on the investment is likely to be relatively small and barely perceptible for website users.
Ultimately, visitors don’t care what your Google PageSpeed Insights score is. They just want to access your content quickly and get on with their day.
After all, who wants to wait 10 seconds for a page to load? Google’s own data shows that visitors are 123% more likely to leave a page as the load time increases from 1 second to 10 seconds.
So, the real question is: Is your site fast enough?
To figure that out, try using PageSpeed Insights in combination with another page speed measurement tool. A tool that doesn’t rely on Google’s data may give you a broader view of your site’s health.
Semrush’s Site Audit tool measures your page speed and gives deep insights into the factors affecting it. This provides you with valuable context to your Google PageSpeed Insights score.
Site Audit also scans your website for over 140 technical site health and SEO issues. Then, you get a custom to-do list for your site. So you’ll know exactly what to fix.
To check your page speed, open the Site Audit tool. Then, enter your site in the search bar, and click “Start Audit.”

Next, configure the settings and click “Start Site Audit.”

You’ll see a dashboard like this one. Click “View details” in the section called “Site Performance.”

Within the “Site Performance” report, you’ll see your average page load speed in seconds.

How Does My Google PageSpeed Insights Score Affect SEO?
Google isn’t running your site through PSI and using it to rank you.
That said, the Google PageSpeed score is based on factors that can affect SEO, like page speed and page experience.
So, taking action to improve your PSI score is likely to have a positive impact on your search rankings.
That’s why it’s important to track your PSI score and try to improve over time.
How to Improve Your Google PageSpeed Insights Score
It’s easy to run an analysis. However, if you aren’t a backend developer or specialized in technical SEO, it can be tricky to figure out what the suggestions mean and how to implement them.
Here’s an example of the suggestions PageSpeed Insights delivers:

While the jargon might seem intimidating, many of the PageSpeed Insights suggestions are simpler than they look.
Here’s a step-by-guide to implementing Google’s suggestions to boost your PSI score. For each step, we’ll explain why it’s important, how to do it, and whether you might need developer support.
1. Eliminate Render-Blocking Resources
Render-blocking resources prevent a webpage from loading quickly. This is because resources such as CSS, JavaScript, and font files force the browser to load them before displaying the page.
Getting rid of these roadblocks can make your page load faster and improve your Google PSI score. To do that, follow these steps:
- Look for "Eliminate render-blocking resources" in the "Opportunities" section of your PSI report.

- Click on the arrow next to the suggestion to see the list of resources that are causing the issue.
The list will show you which resources are blocking the page from rendering quickly and the potential time savings in milliseconds.

- Once you’ve identified the render-blocking resources, the next step is to figure out which ones aren’t essential for the functionality of the website so they can be removed.
If you’re not familiar with coding or website development, you are likely to need developer support for this step.
2. Reduce Server Response Times (TTFB)
The server response time, also known as TTFB (time to first byte), is the time it takes for the browser to receive the first byte of data from the server. A slow TTFB can negatively impact page load speed, as it delays the time it takes for the browser to receive the page’s content.
When a user tries to access a webpage, the browser makes a network request to fetch that content. The server receives the request and returns the page content.

Google PSI will provide the recommendation “Reduce initial server response time” when the browser waits more than 600 ms for the server to respond to the request. Of course, the faster, the better.

To reduce server response times, you can try the following:
- Choose a web hosting service that offers fast servers and low latency
- Optimize the server’s application logic to prepare pages faster
- Optimize how your server queries databases, or migrate to faster database systems
- Upgrade your server hardware to have more memory or CPU
- Use a content delivery network (CDN) to distribute your page’s resources across multiple servers, reducing the distance and time it takes for those resources to be delivered to the user
You’re likely to need support from a developer or your web host for this.
3. Properly Optimize Your Images
Images (especially large ones) can significantly increase page load speed.
The Google PSI report shows you all images on your page that aren’t appropriately sized and displays the current size and potential savings in kibibytes (KiB). Resizing these images can save you data and improve the page load time.

There are many ways to optimize your images. And the good news is that it’s relatively simple. You can:
- Compress your images using a tool like TinyPNG or ShortPixel before uploading them to your website
- Use the appropriate image format (JPEG, PNG, GIF, or WebP) for each image to optimize the file size and maintain image quality
- Use the “srcset” attribute to serve the appropriate image size based on the user’s device
- Lazy-load images using a WordPress plugin like LazyLoad or Smush
If you have a WordPress website, this is fairly simple to do yourself. Here’s how to use TinyPNG to optimize your images:
- Log in to WordPress
- Click “Add Plugin.” Then search for “TinyPNG.” Once you’ve found the plugin, click “Install” and then “Activate”
- Once you’ve registered your account, go to the “Media Library” and select “Bulk Optimization.”

The plugin will show you how many images you have uploaded and how much space you have saved.

4. Avoid Chaining Critical Requests

Chaining critical requests is when a page needs to download multiple files and assets in order to load.
Let’s say you’re the ecommerce manager at a pet food store. On your landing page for cat food, the text won’t show up until the images of cute kittens have loaded. And for the images to load, the CSS file needs to load first. And so on…
Each request depends on the previous request, creating a so-called chain. And if any of the resources don’t load, the browser won’t render the page. This can cause significant delays.

To avoid these chains, you need to set priorities. That way, the critical resources load first, so the page can be displayed. The less important things are loaded afterward.
A good way to do that is by adding the attributes "async" and "defer" to the code of your website.
The "async" attribute tells the browser to continue loading and showing the rest of the page while the file or asset loads in the background.
The "defer" attribute instructs the browser to download the file or asset after the page is visible to the user. This way, the page is displayed first, then the non-essential stuff loads.
If you’re not able to make changes to the website code yourself, you can ask a developer to add the “async” and “defer” script tags for you.
It’s important to note that using these attributes can cause issues with certain types of scripts. So, make sure to test thoroughly before implementing them on your site.
5. Preload Key Requests
Preloading key requests means telling the browser to prioritize critical assets and download them first. That way, the most relevant files can load faster.
Key requests are anything the page needs at an early loading stage. The most common key requests are fonts. However, this can apply to JavaScript files, CSS files, and images, too.

If your site runs on WordPress, various plugins support preloading, including Preload Images and Pre* Party.
Otherwise, ask a developer to identify the critical requests and add the preload tag to the code.
6. Reduce CSS and JavaScript
CSS is an important part of web design. But CSS files are often larger than they need to be, which slows down your site.
Similarly, JavaScript is crucial to the functioning of your site. But it can also significantly slow down your website if the code is not optimized properly.
Reducing the size of your code—a process known as “minifying”—makes it faster to load.

Minifying your code involves removing unnecessary characters from your CSS and JavaScript files. Such as white space and comments.
There are many tools to minify your code, such as Toptal CSS Minifier, Toptal JavaScript Minifier, and Minify.
You can also consider using JavaScript frameworks or libraries that are designed to be lightweight and fast-loading, such as jQuery or React.
If your site is on WordPress, you can use a plugin to help. Popular plugins for CSS and JavaScript minification include Hummingbird, LiteSpeed Cache, and W3 Total Cache.
Here’s how to use Hummingbird to minify your code:
- Log in to WordPress and select “Plugins” from the dashboard menu
- To install Hummingbird, click “Add Plugin” then “Activate”
- Find “Hummingbird” in the dashboard menu, and complete the setup wizard
- Then head back to the “Dashboard”

- Check that your files are marked “Active” in the Gzip Compression section.

Check out our guide to JavaScript SEO for more detailed instructions on how to optimize the JavaScript code on your site.
7. Defer Offscreen Images
Images are one of the biggest causes of slow page speeds. Especially if they are large or not optimized. A good way to fix this is to defer the loading of offscreen images.
Offscreen images are images that are not visible on the current screen but are still being loaded by the browser.

By deferring the loading of non-visible images, you can prioritize the images that are visible. So, the page can load faster. You can do this using lazy loading.
Lazy loading means loading images only when they are needed. Such as when they come into view on the screen. This can significantly reduce the amount of time it takes to load a page, especially on mobile devices with slower internet connections.
WordPress has plugins that can do that for you, such as Lazy Loader.
8. Reduce Document Object Model (DOM) Size
The Document Object Model (DOM) is a tree-like representation of the HTML structure of a webpage. A large DOM size can lead to slow loading times and poor user experience.

To reduce your DOM size, you can:
- Ask your dev team to remove unnecessary elements and attributes from the HTML code and remove unused JavaScript or CSS files
- Use server-side rendering (SSR) to render pages on the server before sending them to the client
- Avoid (most) visual page builders because they generate inflated HTML
- Don’t paste text into What-You-See-Is-What-You-Get (WYSIWYG) page builders
- Look for clean-coded themes and plugins
Tools like Google’s Chrome DevTools can help you analyze your DOM size and identify areas for improvement. You may need developer support to implement the changes.
9. Fix Multiple Page Redirects
Redirects automatically forward traffic from one URL to another. They can also slow down your page load speed.
Let’s say you try to access a page that has been redirected. The server tells your browser that the page has moved. Then, your browser tries to retrieve the new URL. This additional step makes it longer to load the new page.
That’s why it’s important to minimize redirects when possible. One redirect already affects page speed. But often, you can run into issues with multiple consecutive redirects. These are known as redirect chains.
Redirect chains often happen as old pages get deleted and newer ones take their place. As a result, there is more than one page between the original URL and the final URL. Like this:

Google can follow up to 10 redirects without reporting an issue in Google Search Console. But redirect chains can unnecessarily slow down your site.
So, to improve your page load time and your PageSpeed Insights score, it’s best to keep things simple. You should redirect straight from the original URL to the newest URL.
The easiest way to get an overview of the redirects on your site is with an SEO tool like Semrush. Open Site Audit. Then, set up a project or select an existing one.

Click the “Issues” tab and type “redirect chain” into the search bar. Click on “# redirect chains and loops.”

This will show you a report containing a list of pages, their redirect type, and the number of redirects.

If you’ve identified any redirect chains, you can likely log into your content management system (CMS) to fix them. You will need to delete the unnecessary redirects and implement a new redirect sending traffic only from the original page to the current one.
Many free WordPress plugins, including Easy Redirect Manager, Redirection, and Simple Page Redirect, will help you modify or set up redirects.
- Log into WordPress, click “Plugins” and then “Add New.”
- Search for “Easy Redirect Manager.” Then, click “Install and activate.”
- Then click “Manage Redirects.”

- In the “Redirect Rules” tab, enter the address of the old URL and the one you would like to redirect to. Then, click “Save.”

Check out our guide to redirects to learn about the different types of redirects and the main best practices.
10. Avoid Overusing Third-Party Code
Third-party code includes scripts, pixels, and plugins. They can slow down page loading times and negatively impact your PageSpeed Insights score.
Third-party code typically comes from other companies—such as analytics tools and advertisers—monitoring your site performance.
Some third-party code is necessary and useful. For instance, you might have the Google Analytics pixel to measure site performance. Or the Facebook pixel to track ad campaigns.
However, you likely have some unnecessary third-party code. Like tools and platforms you no longer use.
That’s why you should regularly audit third-party code on your site. And remove anything that isn’t necessary.
In your PageSpeed Insights report, Google flags third-party code. Along with the transfer size and main-thread blocking time.
Pay special attention to the company names in the gray bars. These are the third-party companies running code on your site. Google also categorizes them (Tag Manager, Social, Utility, Analytics) to help you understand their purpose.

Make a note of any company names you don’t recognize or no longer need. Once you’re sure you don’t need them, take steps to remove their code. This is likely to involve deleting the code from your CMS, uninstalling plugins if your site is on WordPress, or removing tags from your tag management tool.
Google PageSpeed Insights Tool Alternatives
Google PSI is great. But other tools can help you measure and improve your website performance.
Each tool uses different data and gives you slightly different results. And checking more than one tool can give you a more accurate picture of your site’s speed.
Here is an overview of some of the best alternatives to Google PageSpeed Insights.
GTmetrix
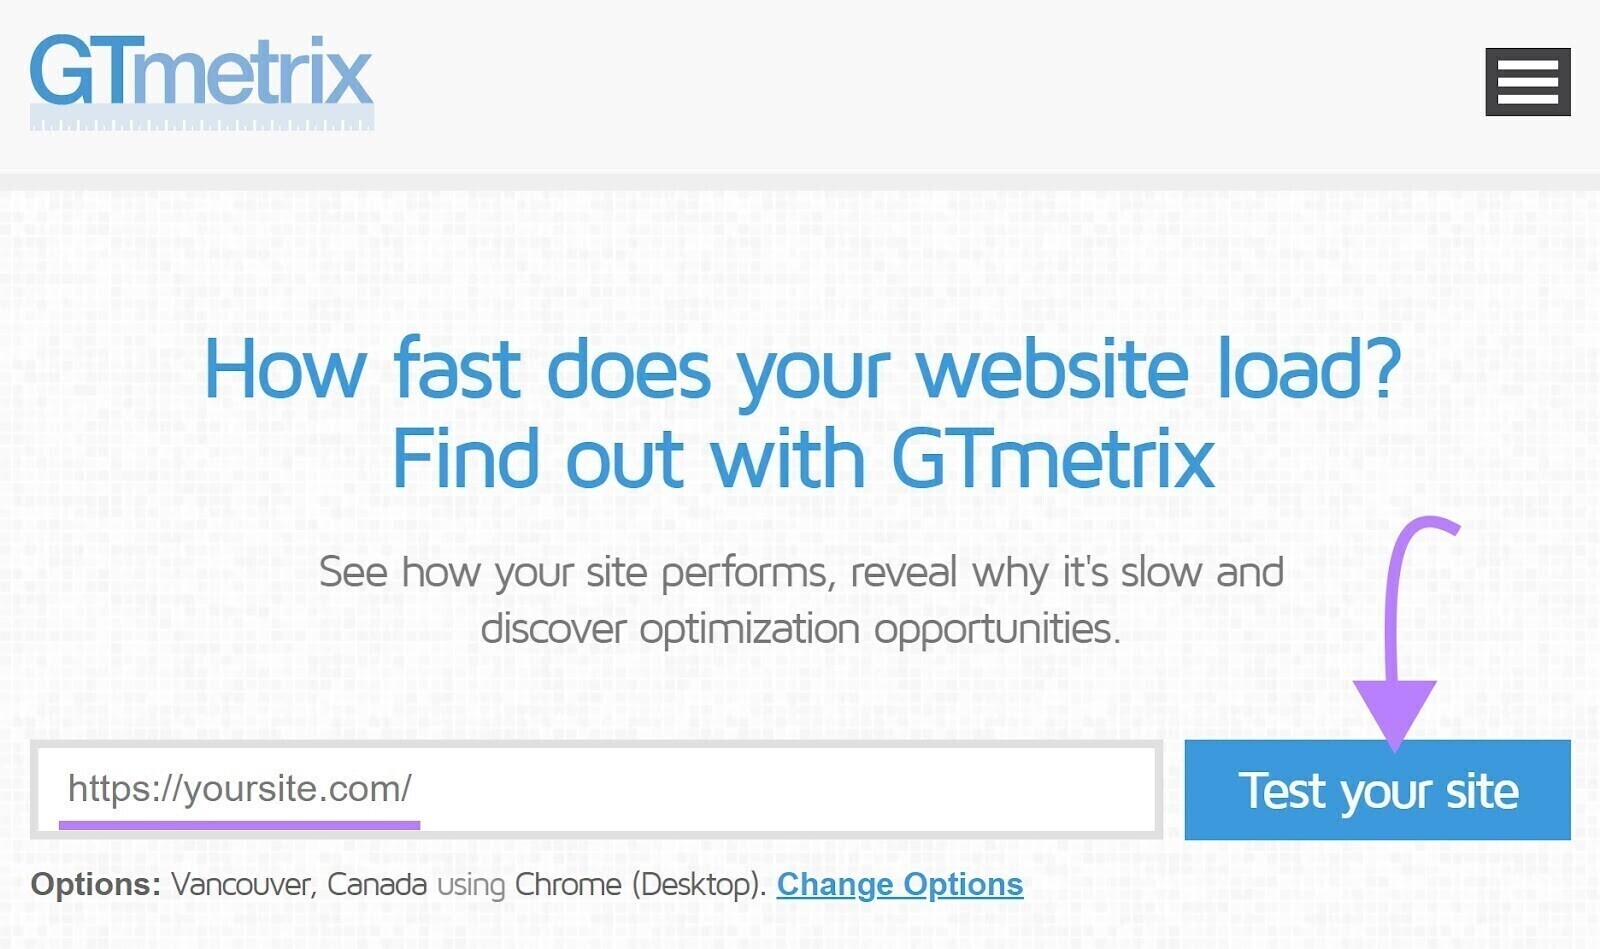
GTmetrix is a free tool that measures a page’s performance. You just enter the URL and choose the server location.
This tool generates a report with various insights, including:
- Your structure score
- Your performance score
- Your Core Web Vitals score
- A speed visualization graphic
- Recommendations to improve performance
WebPageTest

WebPageTest is a free tool that lets you test your website’s performance based on user conditions. Like different locations worldwide, browser, and connection.
It offers advanced analysis options, including:
- Your Core Web Vitals (These might be different from what Google PSI tells you, as the data is different.)
- A detailed breakdown of your site’s performance metrics, including load time and TTFB
- Waterfall charts to visualize the loading process
- Your site’s carbon footprint
Website Speed Test
Website Speed Test is a free tool that allows you to measure a webpage’s performance directly from your Semrush account. The tool is very similar to Google PSI, however, it doesn’t require you to sign up for any different service if you already have a Semrush account.
Just like PSI, Website Speed Test analyzes your site across several different categories, such as performance, accessibility, best practices, and SEO. It also attributes the score to how the site performs in each category and offers opportunities for improvement.
All you need to do is go to the Semrush App Center and find Website Speed Test.
Google PageSpeed Insights vs. Lighthouse

Google Lighthouse provides audits and reports on various aspects of website performance, including performance metrics, accessibility, SEO, and best practices.
Lighthouse and PageSpeed Insights are both:
- Made by Google
- Free to use
- Providing webpage performance data
- Suggesting opportunities to improve page speed
One key difference is that Lighthouse provides more detailed information about each issue it flags. For example, Lighthouse will tell you not only whether an image is optimized but also how much smaller the optimized version should be. This level of detail can help you prioritize and implement the recommendation.
Google PageSpeed insights, sometimes referred to as Google Insights, only evaluates one webpage at a time. Lighthouse can give you data for your entire website.
That said, there is a great deal of overlap in the data between the two tools. Both look at Core Web Vitals and use the same performance metrics.
To use Lighthouse, open the Chrome Developer Tools (press F12 or right-click and select “Inspect”) and go to the “Lighthouse” tab.
From there, you can run an audit for your website and generate a detailed report with recommendations for improvement.
You can also use Lighthouse as an extension in Google Chrome browser.

To learn more, read our guide to Google Lighthouse and page speed.
Audit Your Site to Monitor & Fix Page Issues Faster
Semrush’s Site Audit is a useful tool to kickstart your site speed optimization and boost your Google PageSpeed Insights score.
It comprehensively scans your website for over 140 technical and SEO issues, generating an in-depth report that identifies all areas needing improvement.

The “Performance” report includes essential metrics, such as page load speed, average load speed, and the number and sizes of JavaScript and CSS files.
What’s more, you can see at a glance all key errors and issues impacting your site’s performance and PSI score. Such as:
- Large HTML page size issues
- Redirect chains and loops
- Slow page load speeds
- Uncompressed pages
- Uncompressed JavaScript and CSS files
- Uncached JavaScript and CSS files
- Too large JavaScript and CSS total size
- Too many JavaScript and CSS files
- Unminified JavaScript and CSS files
- Slow average document interactive time
By incorporating data analysis, done-for-you prioritization, and detailed instructions, the report can help you quickly identify and resolve technical issues that affect your PSI score.
Track & Improve Your Google PageSpeed Insights Score with Semrush
Once you start implementing Google’s recommendations, you can use Site Audit to keep track of your progress.
Making your website more efficient is a continuous process. Google PSI will just show you the performance at a given moment. Semrush shows the progress over time, like this:

Using Site Audit and Google PageSpeed Insights together, you can prioritize and implement site improvements, speed up your site, and improve your website’s SEO. Sign up for a free account today to get started.