
SEO performance refers to how well a website ranks on search engines (like Google) and attracts organic traffic.
But there are many useful ways to monitor SEO results.
1. Organic Traffic
Organic traffic is the number of visits that come to your site from organic (meaning unpaid) search engine results.
It’s a good indicator of how well your webpages rank for relevant keywords (terms and phrases that your ideal audiences search online). And how many visits you get that may eventually translate to more customers.
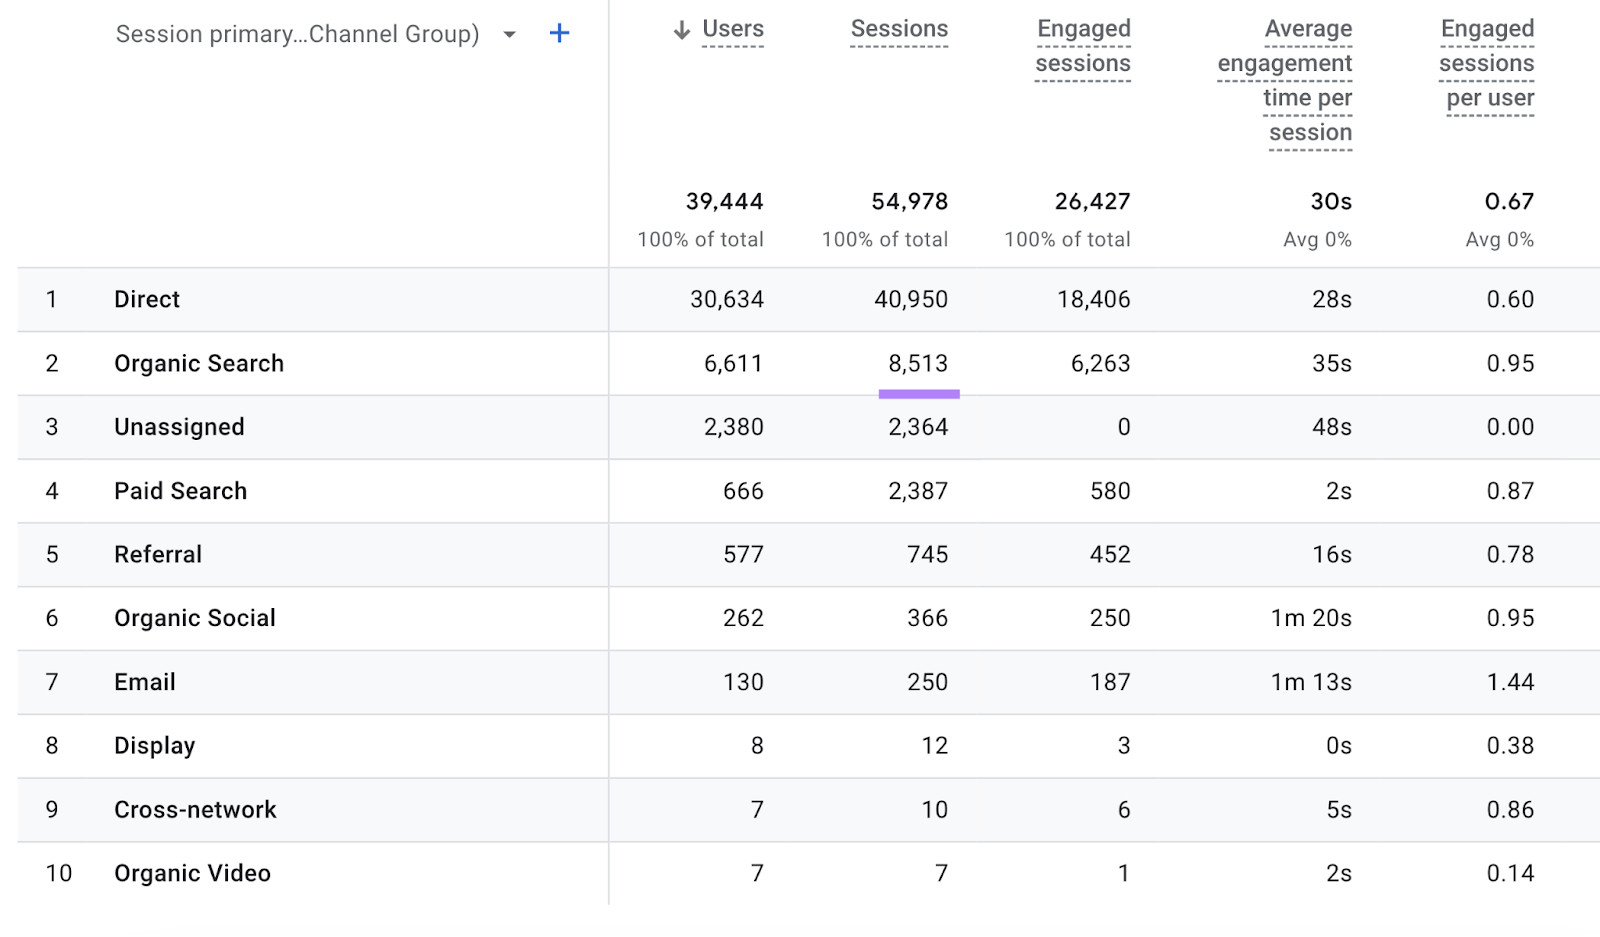
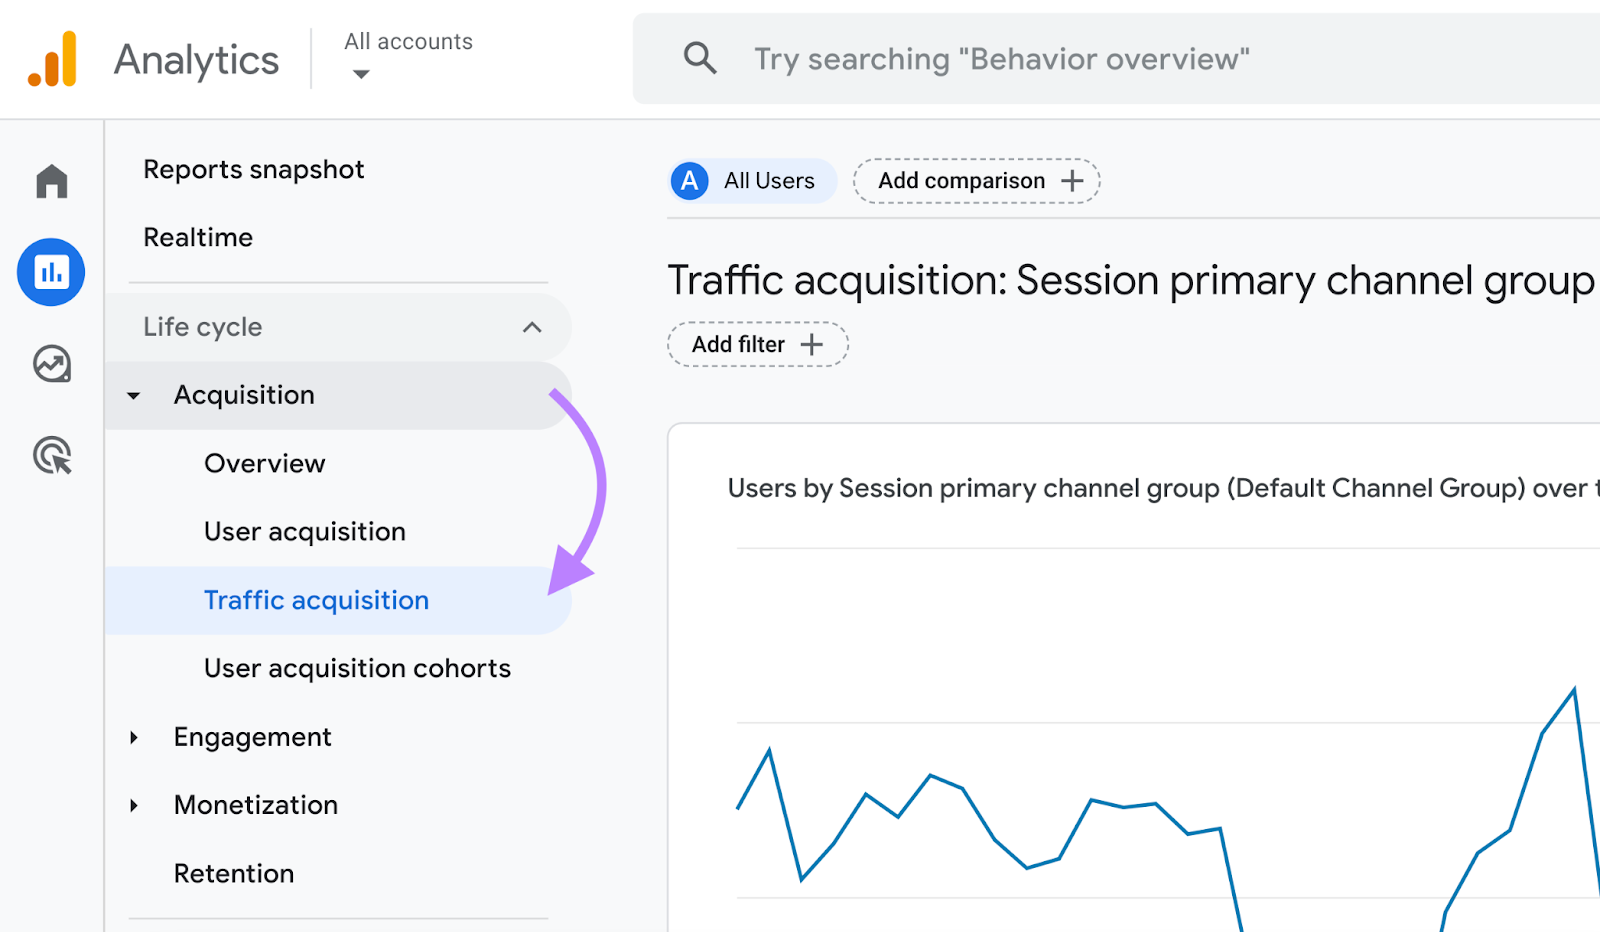
One way to measure your organic traffic is by using Google analytics 4. And heading to “Reports” > “Acquisition” > “Traffic acquisition.”
Like this:

Then, adjust the report to show data for the last full month. And check the number of sessions (visits) you’ve received in the “Organic Search” row.
To assess how strong your organic traffic performance is, compare it against the main players in your space. Go to Traffic Analytics, enter your main competitors’ websites, and click “Analyze.”
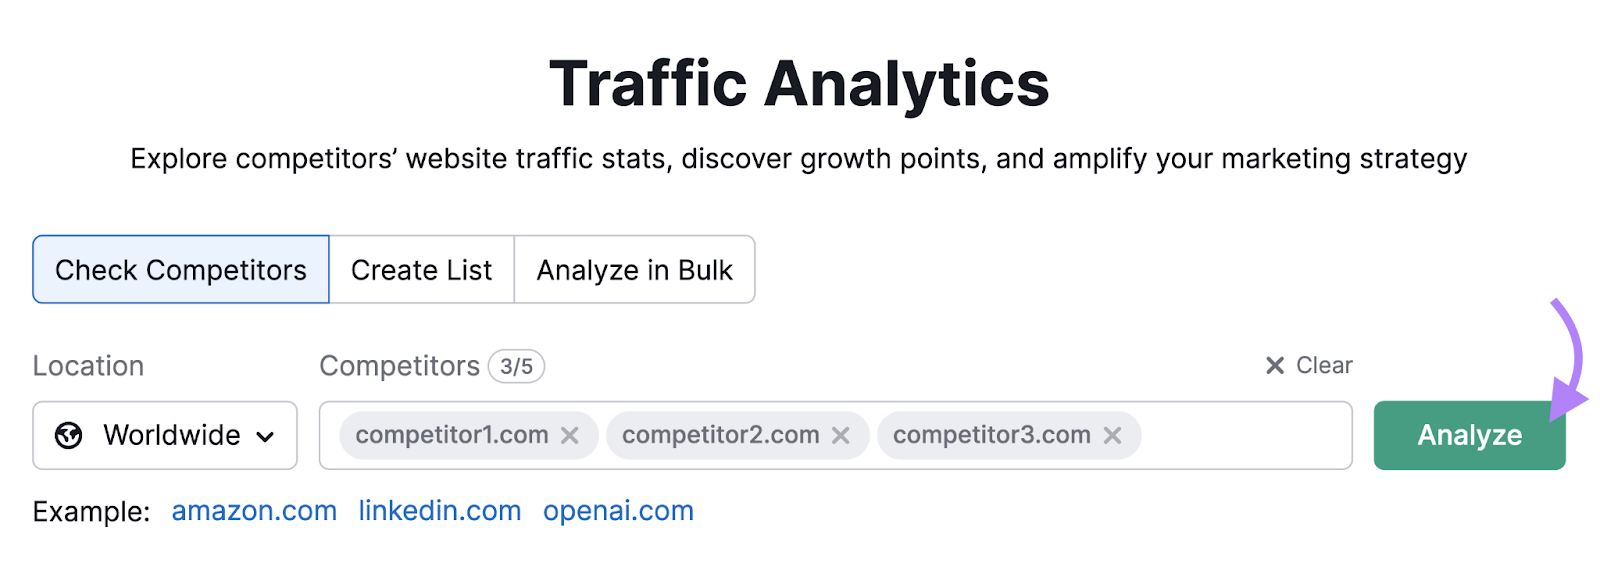
Make sure the selected time range matches what you used in Google Analytics.
Then, scroll down to the “Traffic Channels” section and hover over “Organic Search” to see how much organic traffic your competitors get.
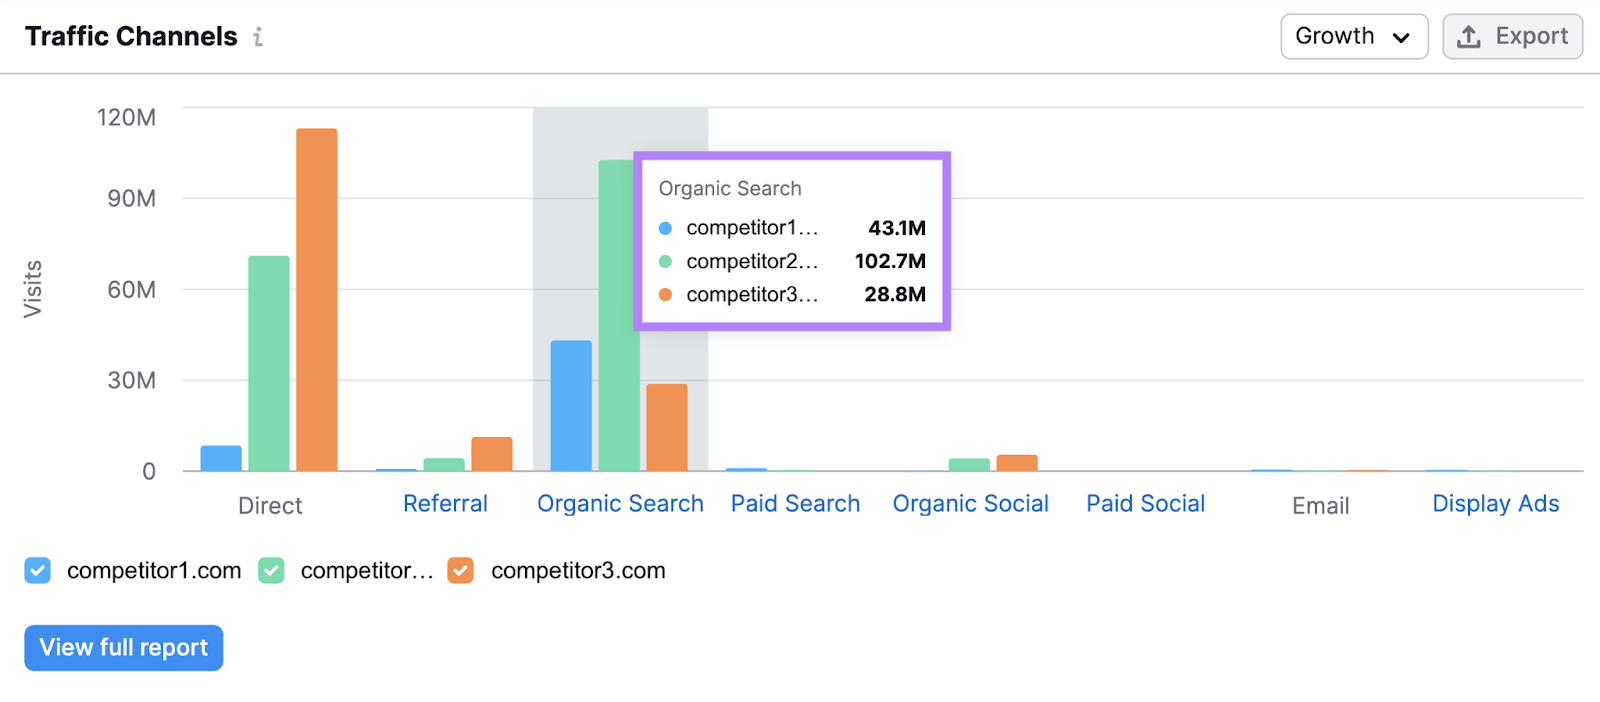
Compare these values to your own organic traffic measurement.
If your competitors are getting significantly more traffic from organic search, perform a full competitor analysis (which includes finding search terms they target, analyzing their content, etc.) to figure out why. And come up with a strategy to outperform them.
If you need help, check out our SEO competitor analysis guide that teaches you how to do that.
2. Keyword Rankings
A keyword ranking is your website’s position on a search engine results page (SERP) for a specific keyword or phrase.
And the higher you rank, the more traffic you’re likely to drive to your site.
But a website’s keyword rankings can frequently change. For any number of reasons.
Perhaps Google updates its algorithm, you lose backlinks, or your competitors update their content to improve it.
So, keeping a watch on your SEO rankings is important.
Losing ranking positions may mean losing traffic to your site—which may hurt your business.
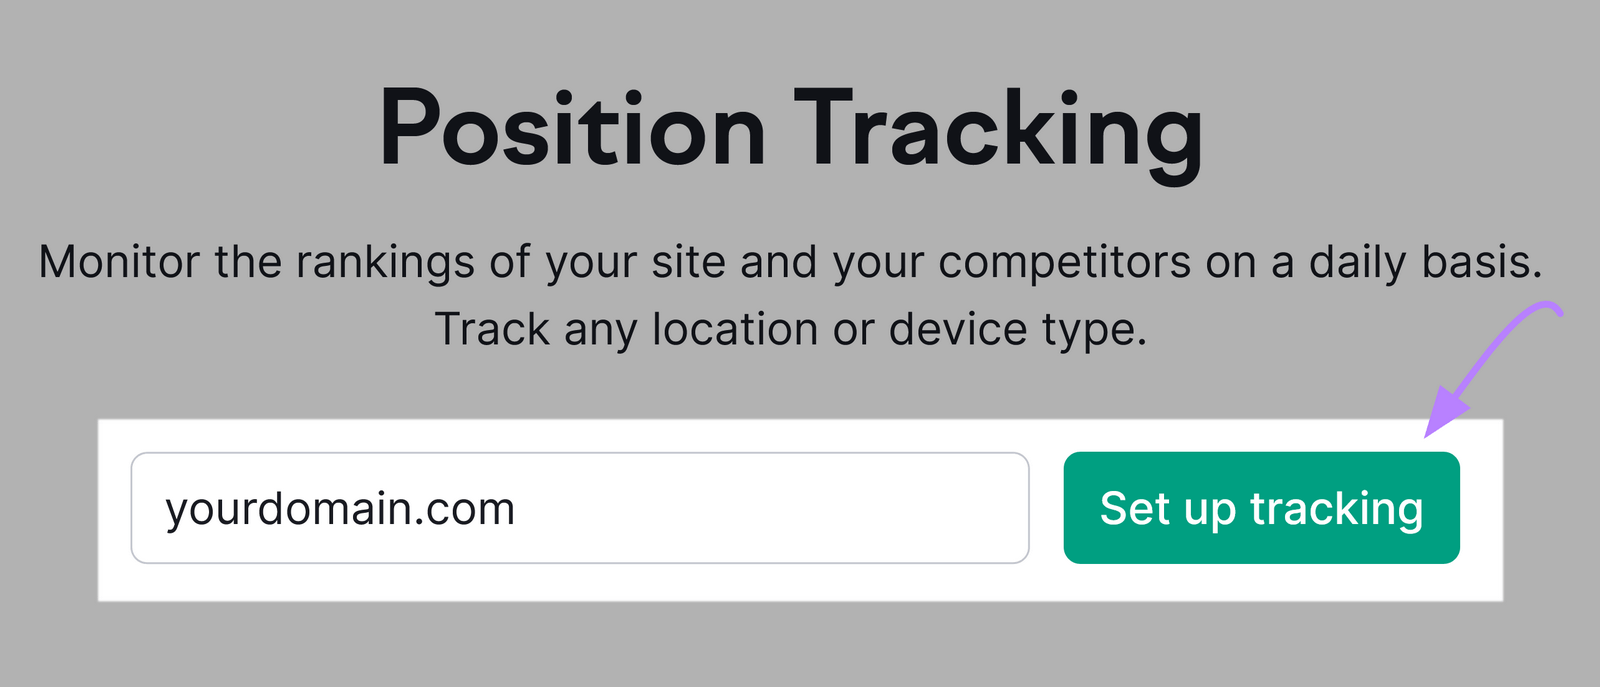
One of the best ways to monitor your keyword rankings is to set up a campaign in our Position Tracking tool. It’ll track your rankings daily. And automatically.
Open thetool, enter your domain name, and click “Set up tracking.”
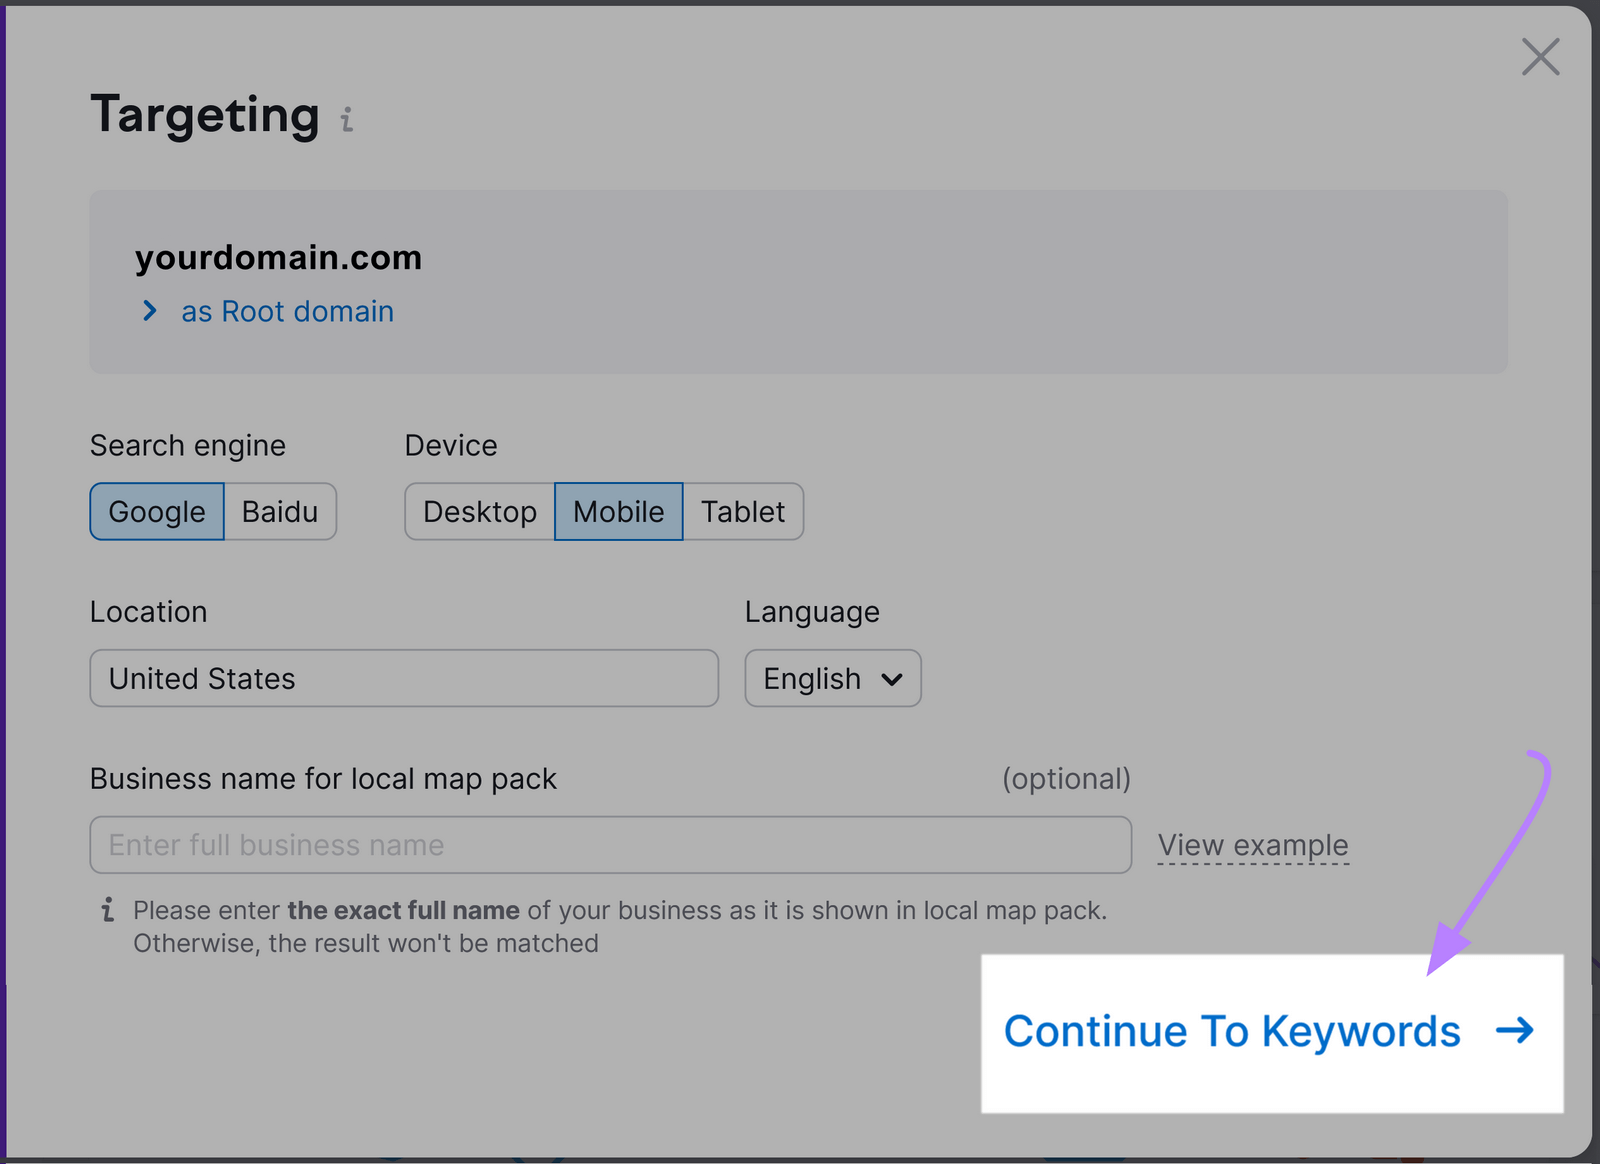
The tool will ask you to choose a domain (“Root domain,” Subdomain,” etc.). And to pick a search engine, device, location, and language to track your rankings.
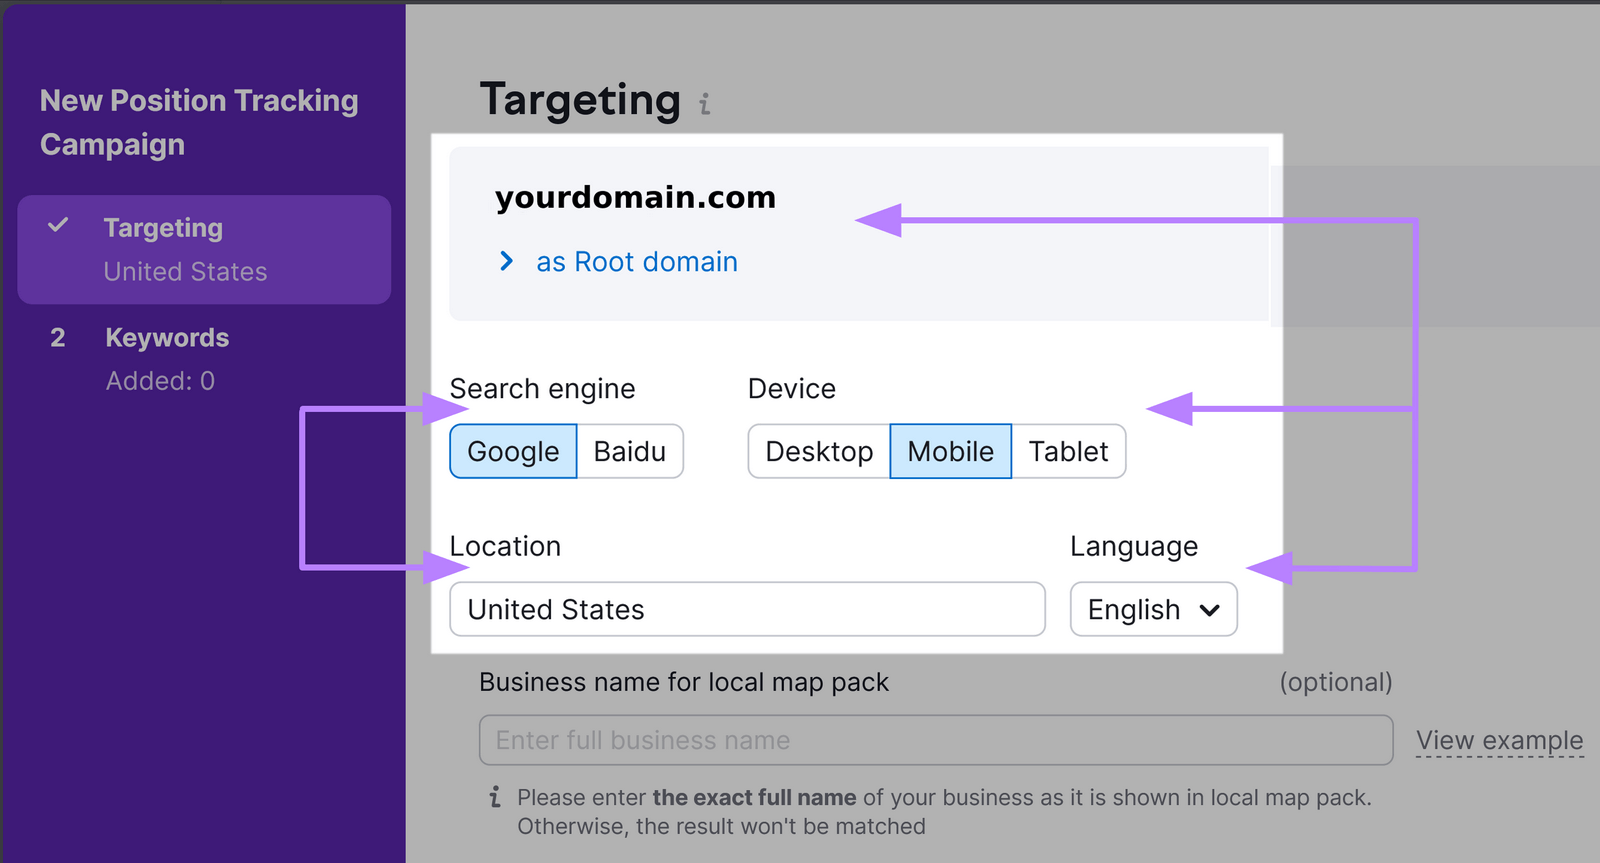
When you’re done, click “Continue To Keywords.”
In this next screen, add the keywords you want to track.
You can add them manually or click the “Import from…” button to import a list from an existing resource like a CSV file or a previous campaign. Or get suggestions from Semrush.
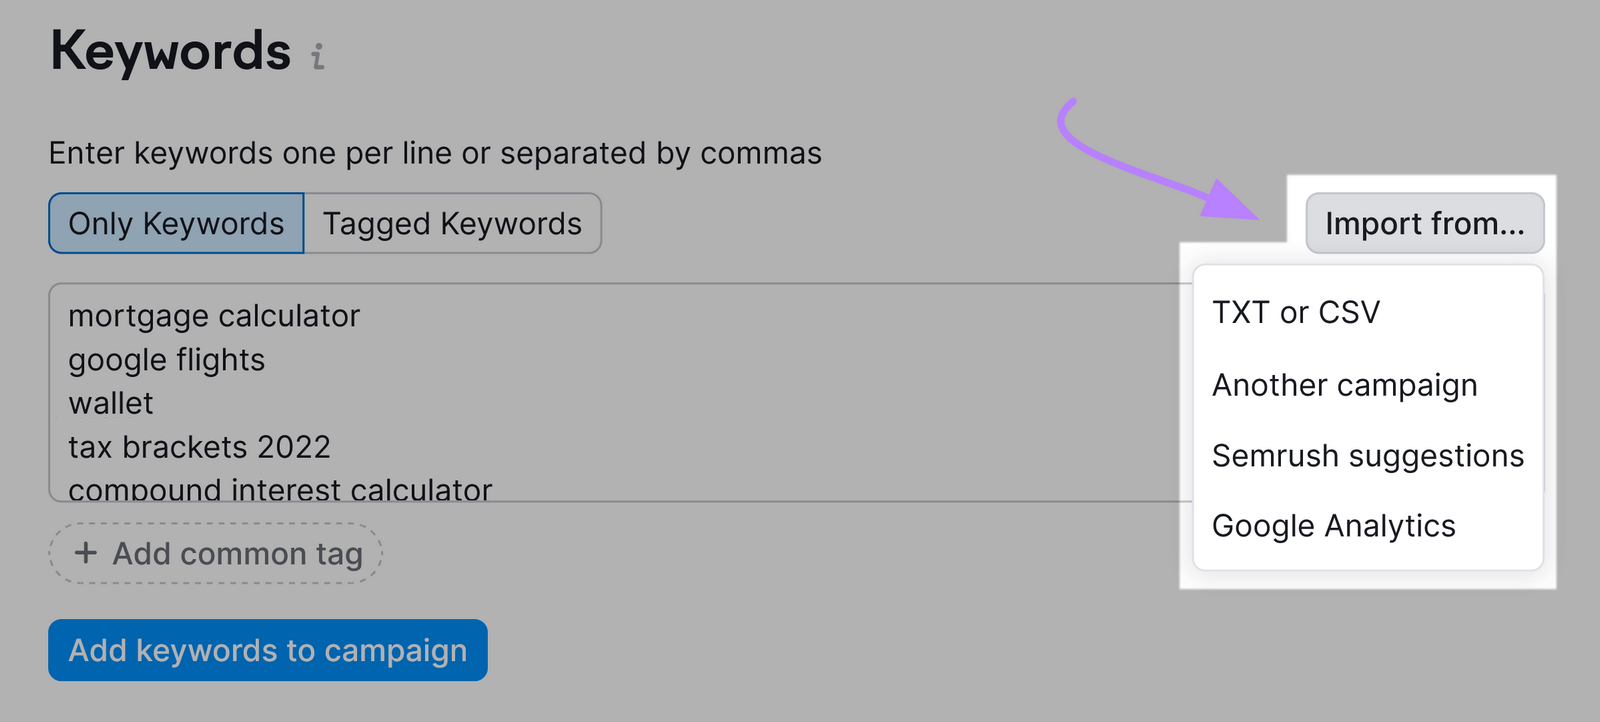
Then, click “Start Tracking.”
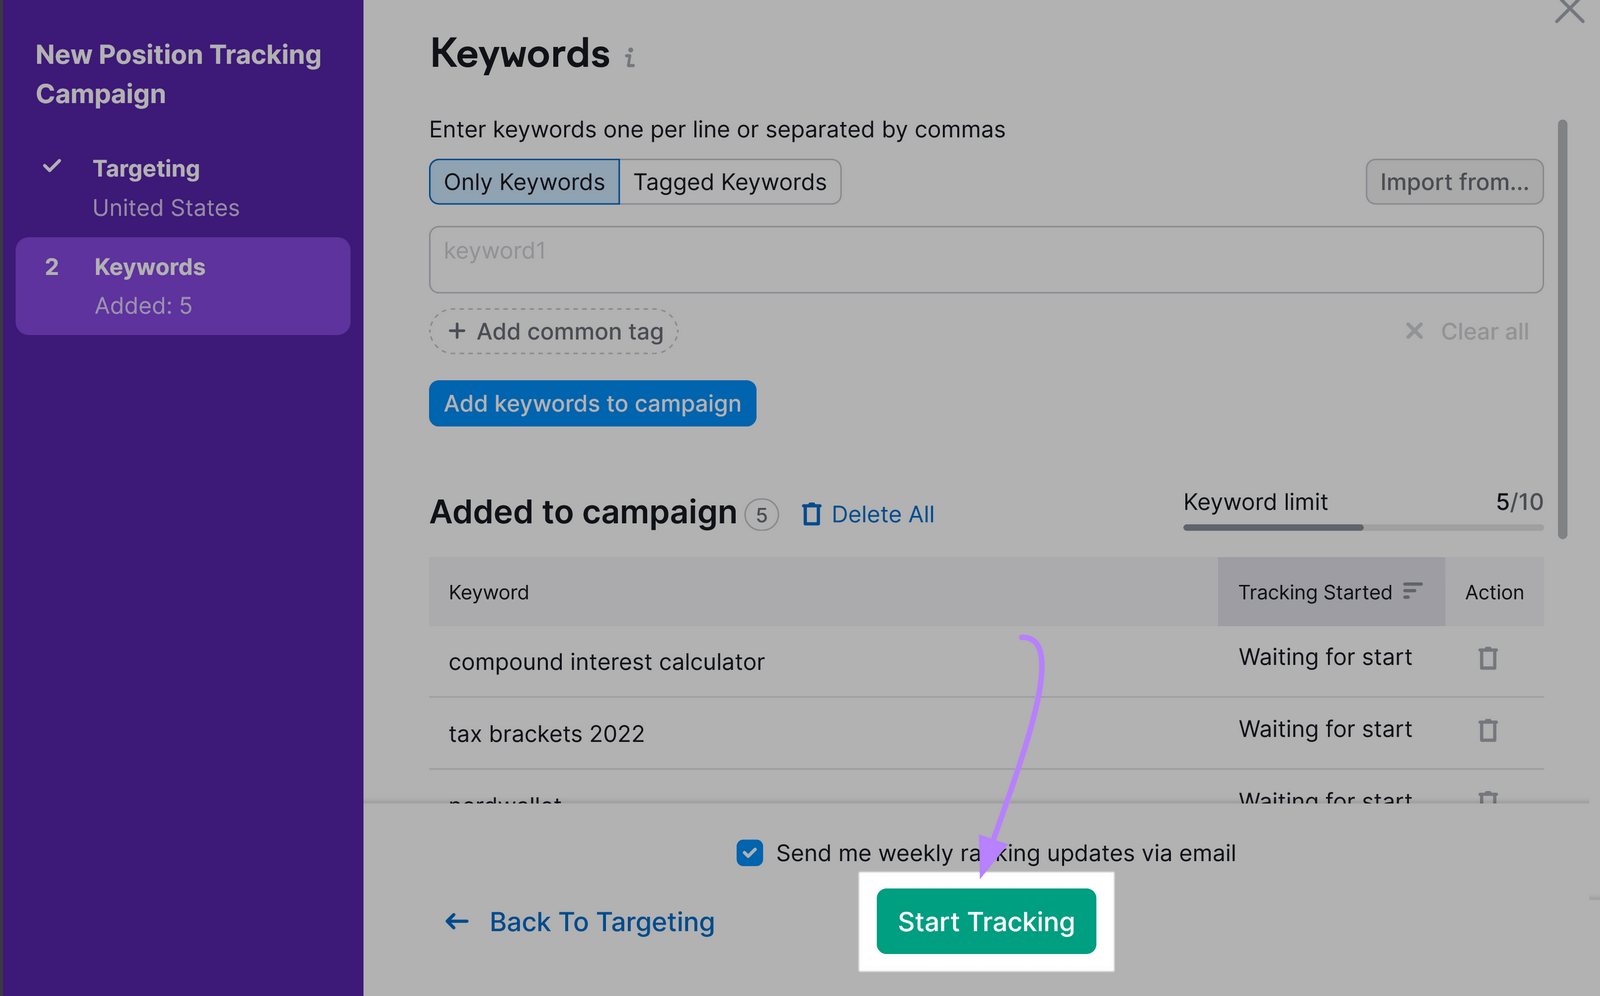
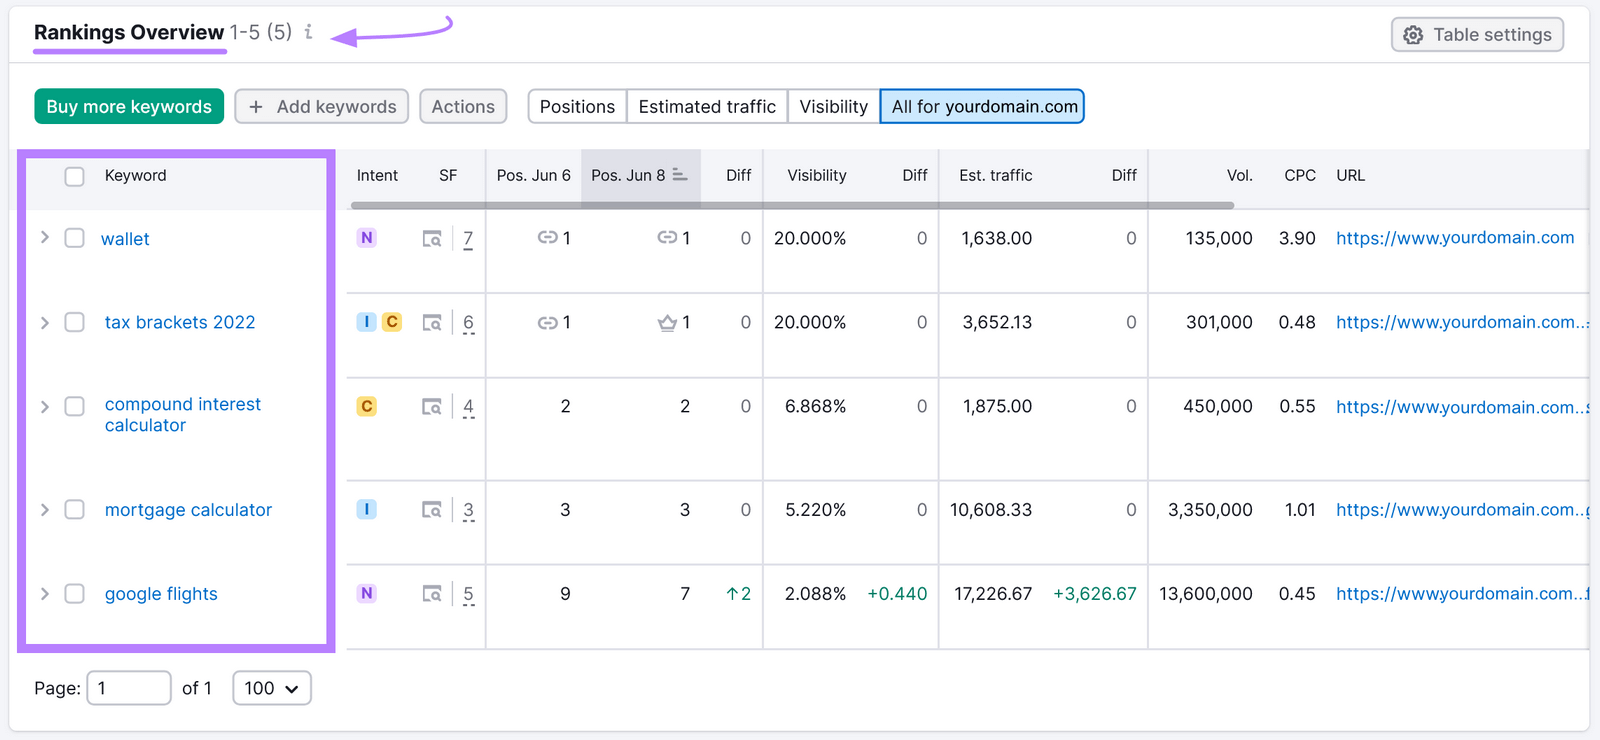
Once it’s all set up, you’ll see your rankings in the dashboard.
Like this:
If you’re unhappy with where you currently rank, you can take steps to improve your rankings by getting authoritative sites to link to you, increasing your page load speed, and using other optimization tips..
3. SERP Visibility
SERP visibility is a measure of how often and how prominently your website appears on search engine results pages for relevant keywords.
It takes keyword rankings into account. But also the presence of SERP features—nontraditional organic results like featured snippets, knowledge panels, image packs, and others.
You can easily check your website’s visibility using the Position Tracking tool we outlined earlier.
First, you’ll see a “Visibility” index in the dashboard.
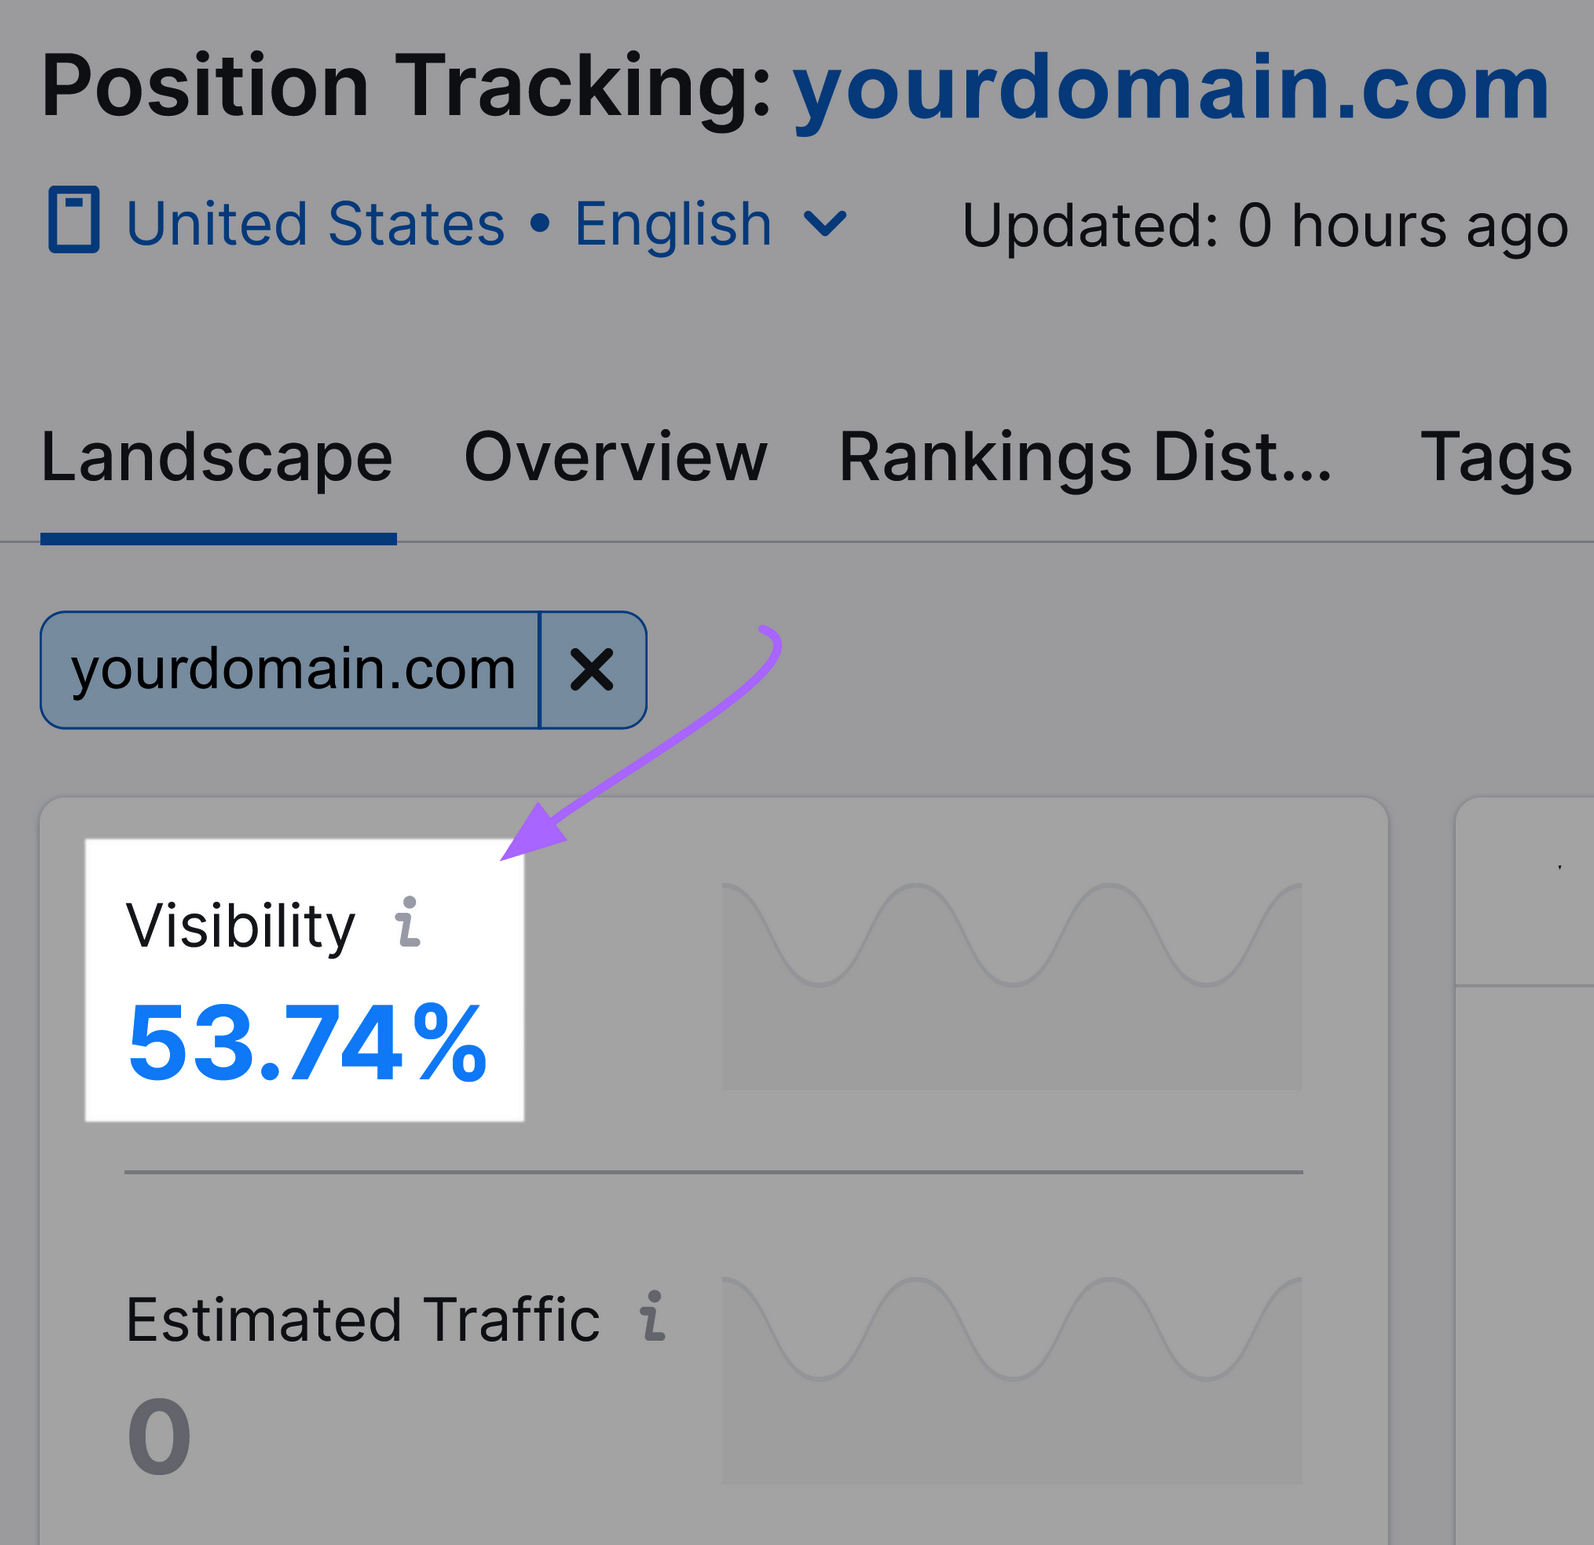
This percentage is based on click-through rate and shows your site’s progress in Google’s top 100 results for the keywords in your tracking campaign.
A 0% visibility score means your domain isn’t ranking in Google’s top 100 results for any of your tracked keywords.
And a 100% visibility score means your domain ranks in the first position in the SERP for all your tracked keywords.
The higher your visibility percentage, the better your chances of bringing visitors to your site.
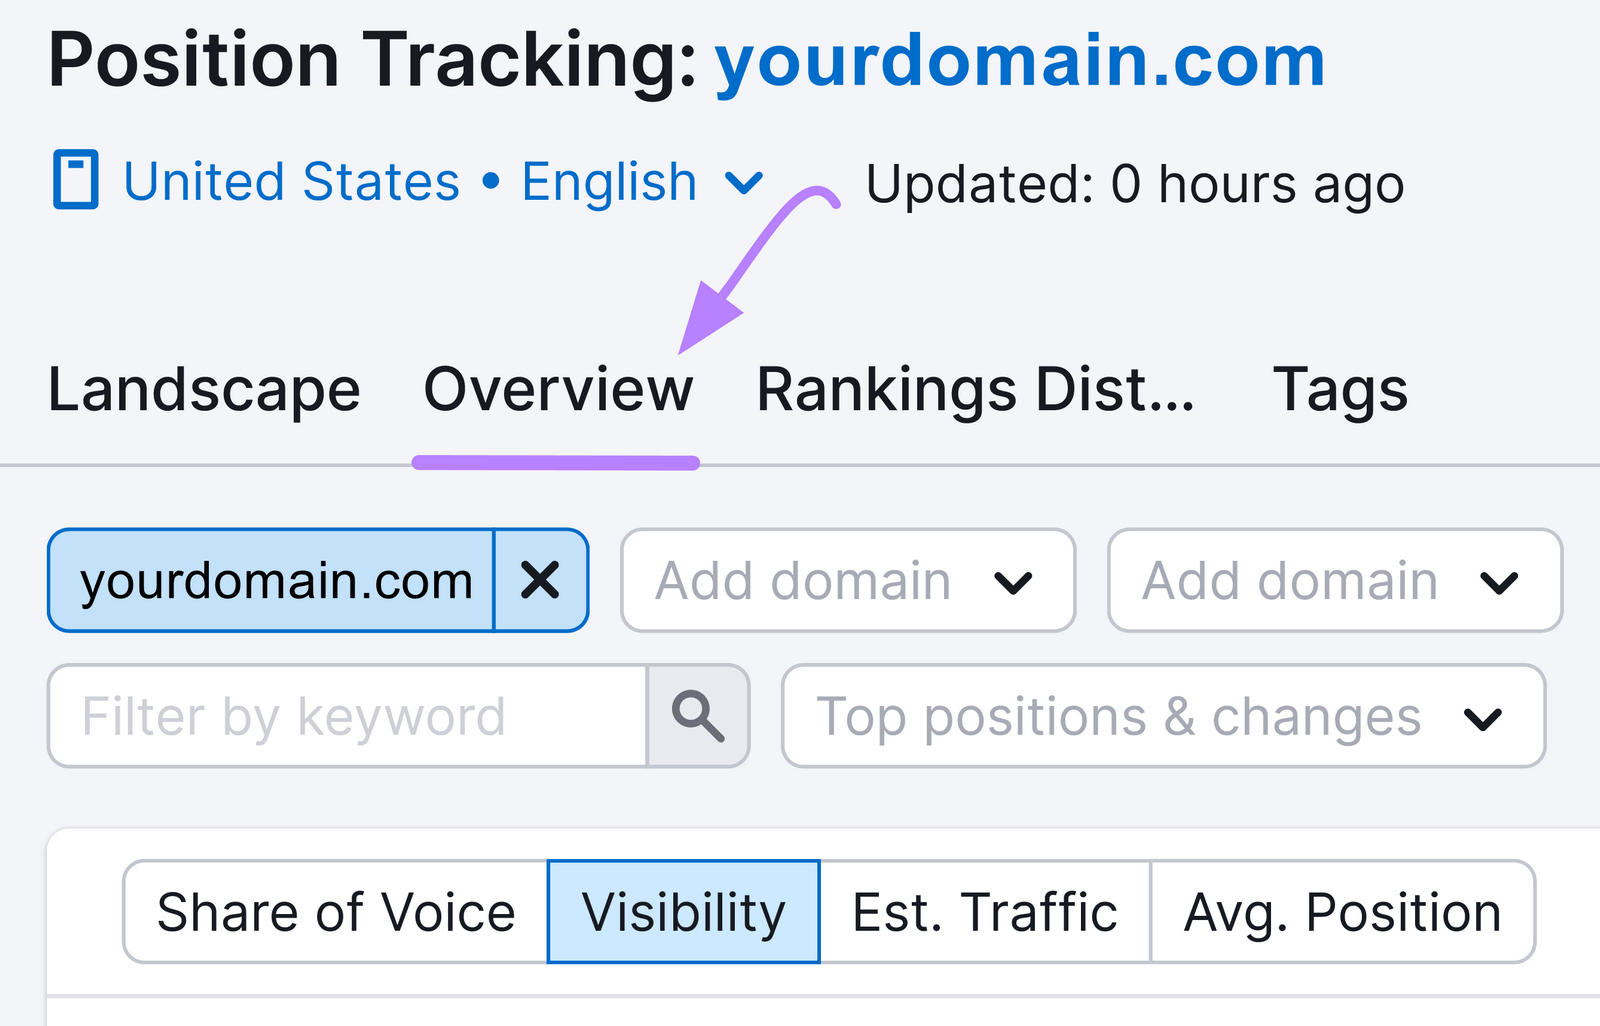
Now, click on the “Overview” tab.
Scroll down, and you’ll see a table with keywords from your campaign and how much visibility you have for each one.
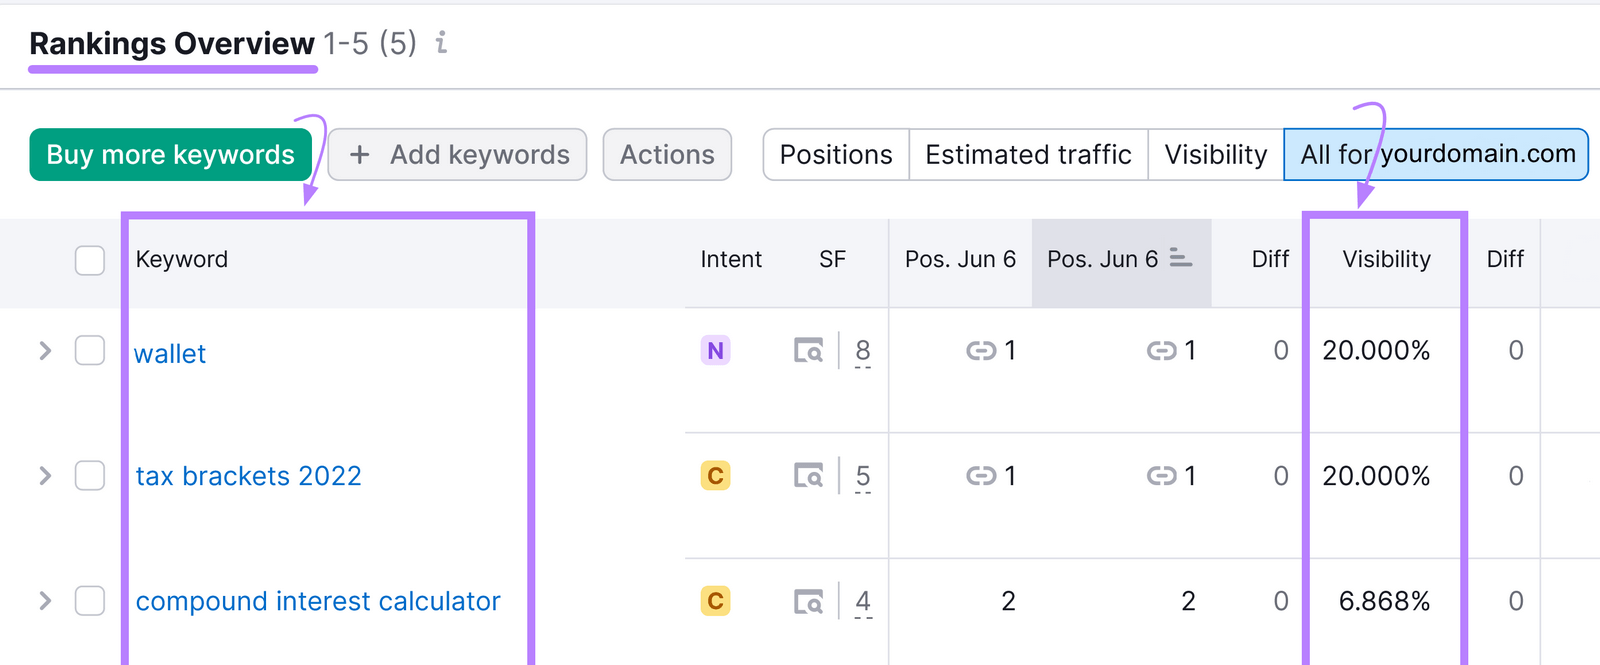
Keep a close eye on this table. And do what you can to bring your visibility percentage up.
For example, some best practices to increase visibility include:
- Editing your content to better optimize for the SERP features that are currently appearing in the search results
- Adding structured data (special code) to your pages to help Google understand and better present your content in the SERPs
- Building more backlinks (links from other websites that point to your pages)
4. Impressions
Impressions are the number of times your site was viewed in search results in a given time period.
It’s an important metric for tracking your SEO progress because it gives you an idea of whether your efforts are helping you appear in search results.
Often, the first sign of SEO success is an increase in the number of organic impressions for your website.
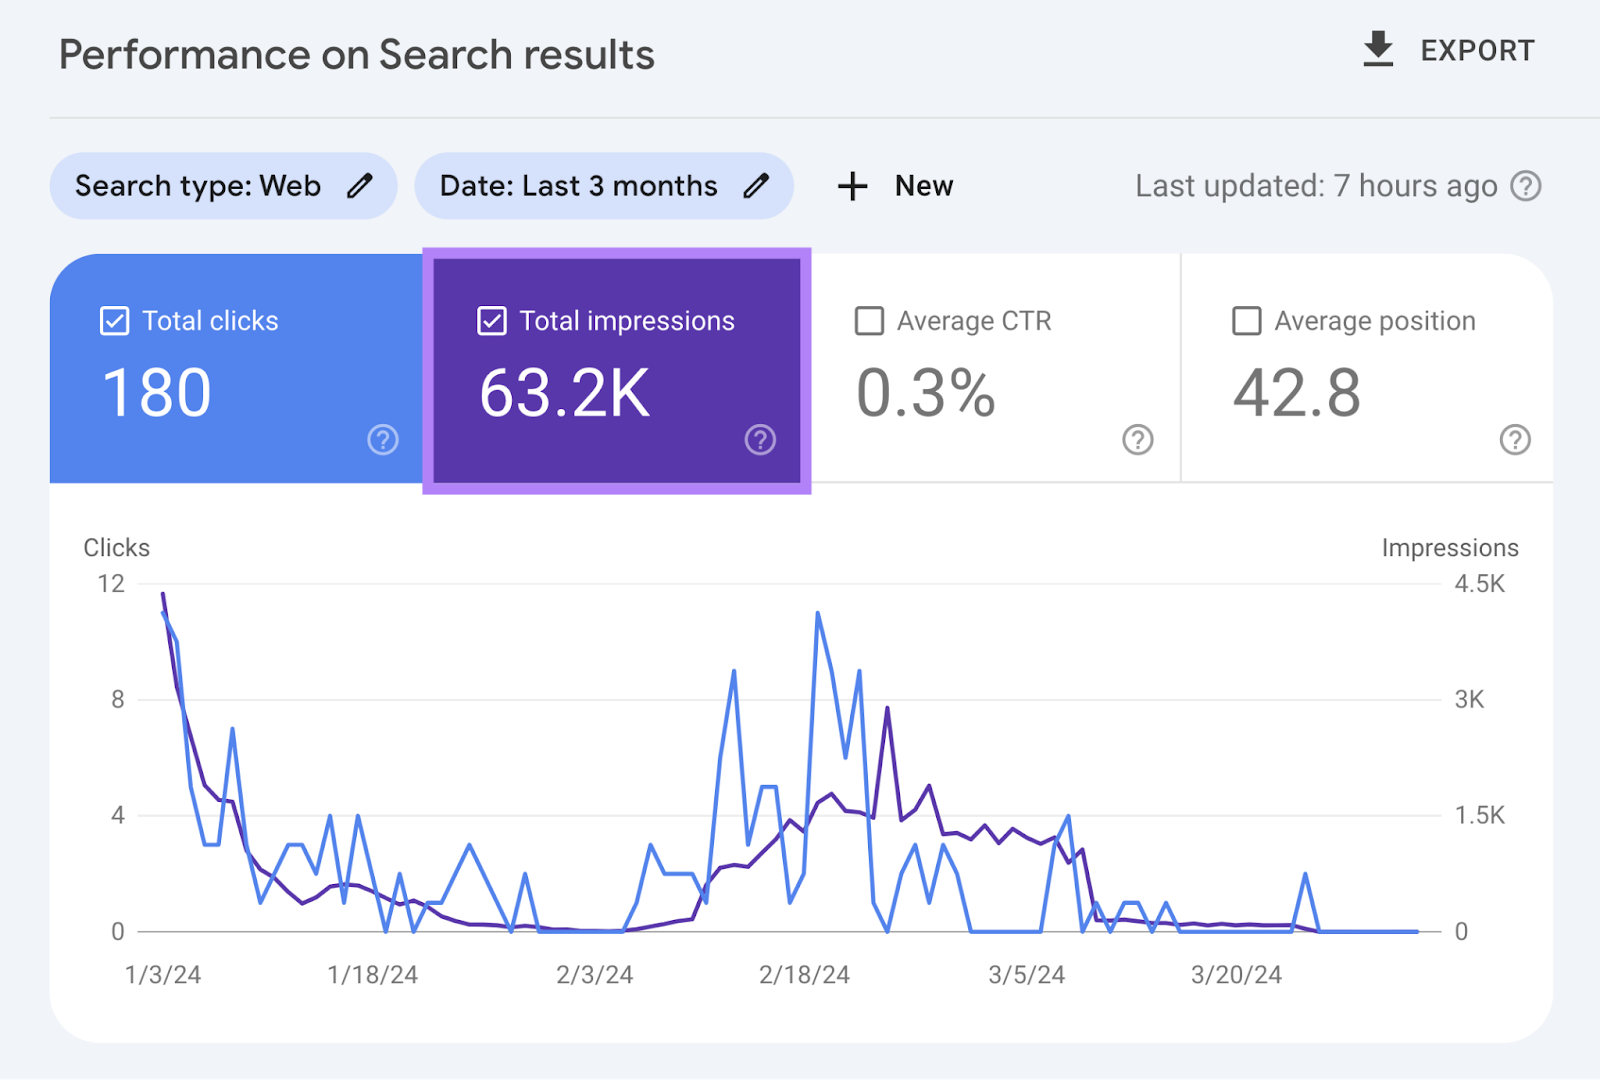
To track impressions, go to the “Search results” report in Google Search Console.
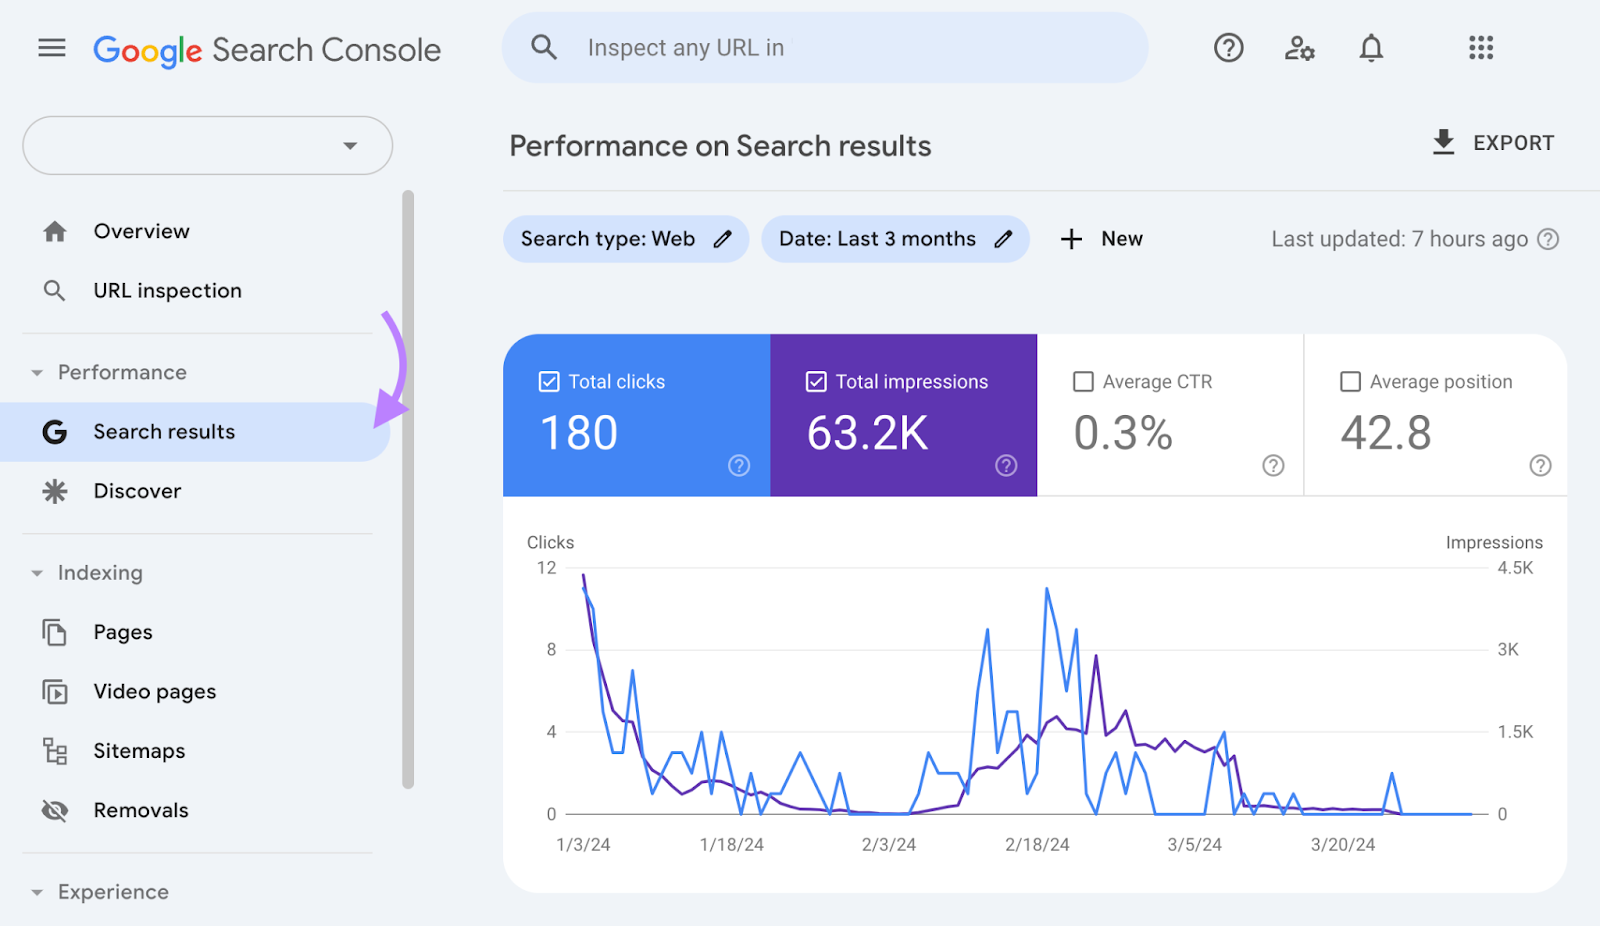
And you’ll see the total number of impressions your website received in the selected time frame.
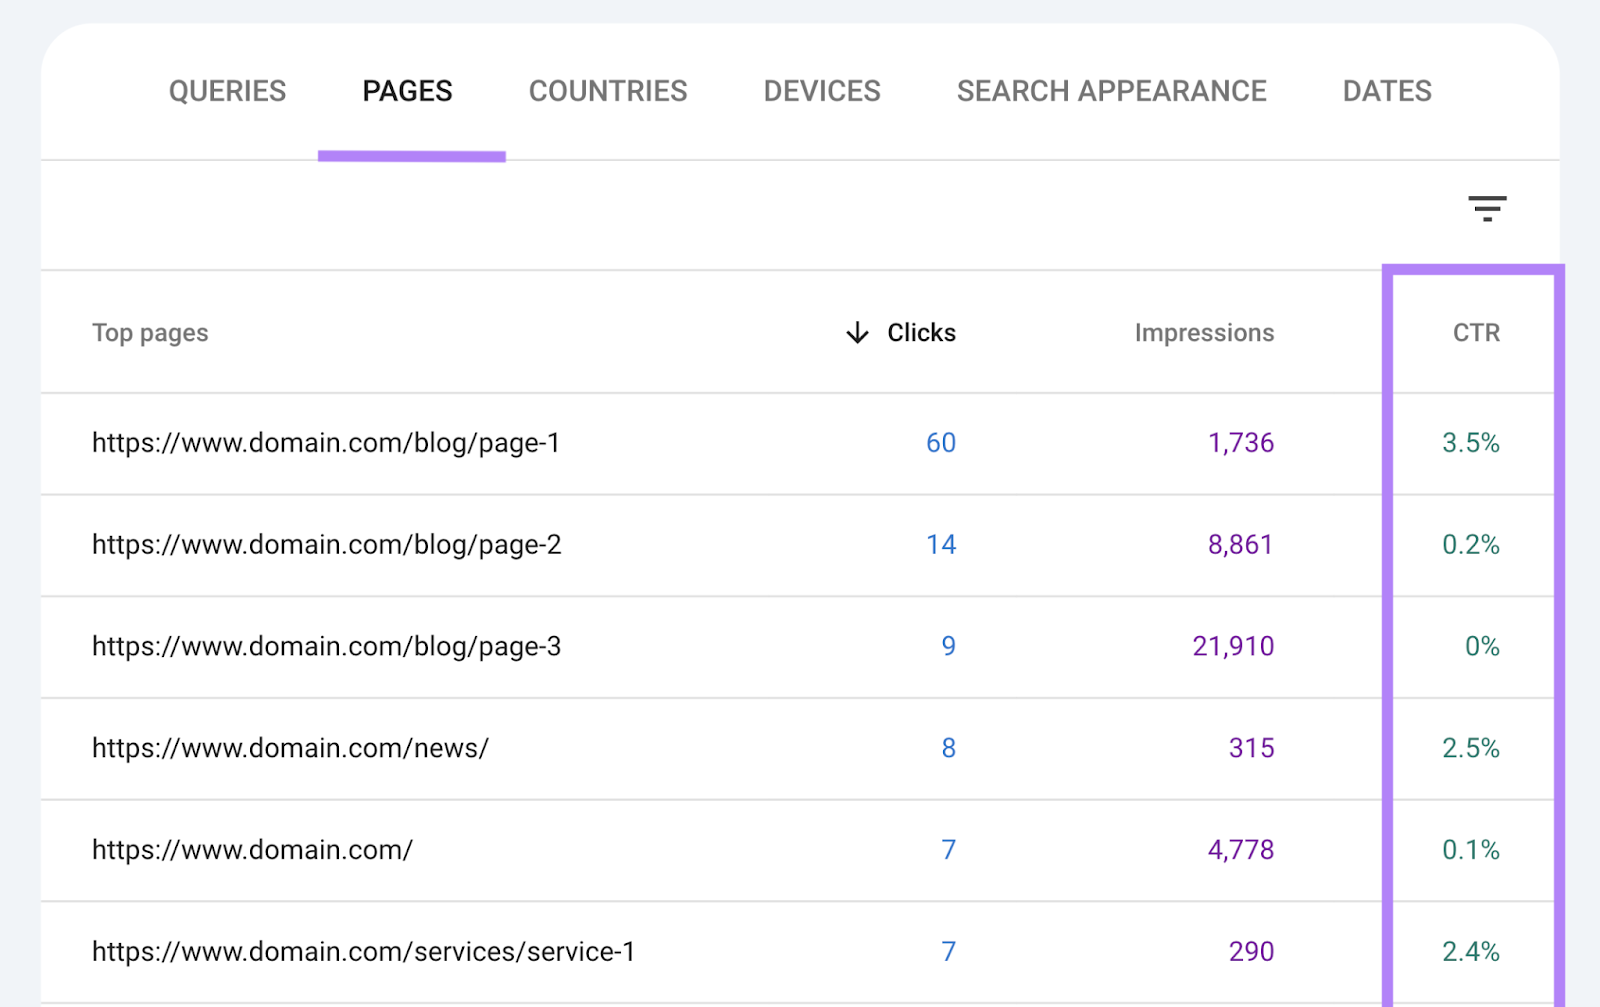
Now, scroll down and click the “Pages” tab. And you’ll see impression data on a page-by-page level.
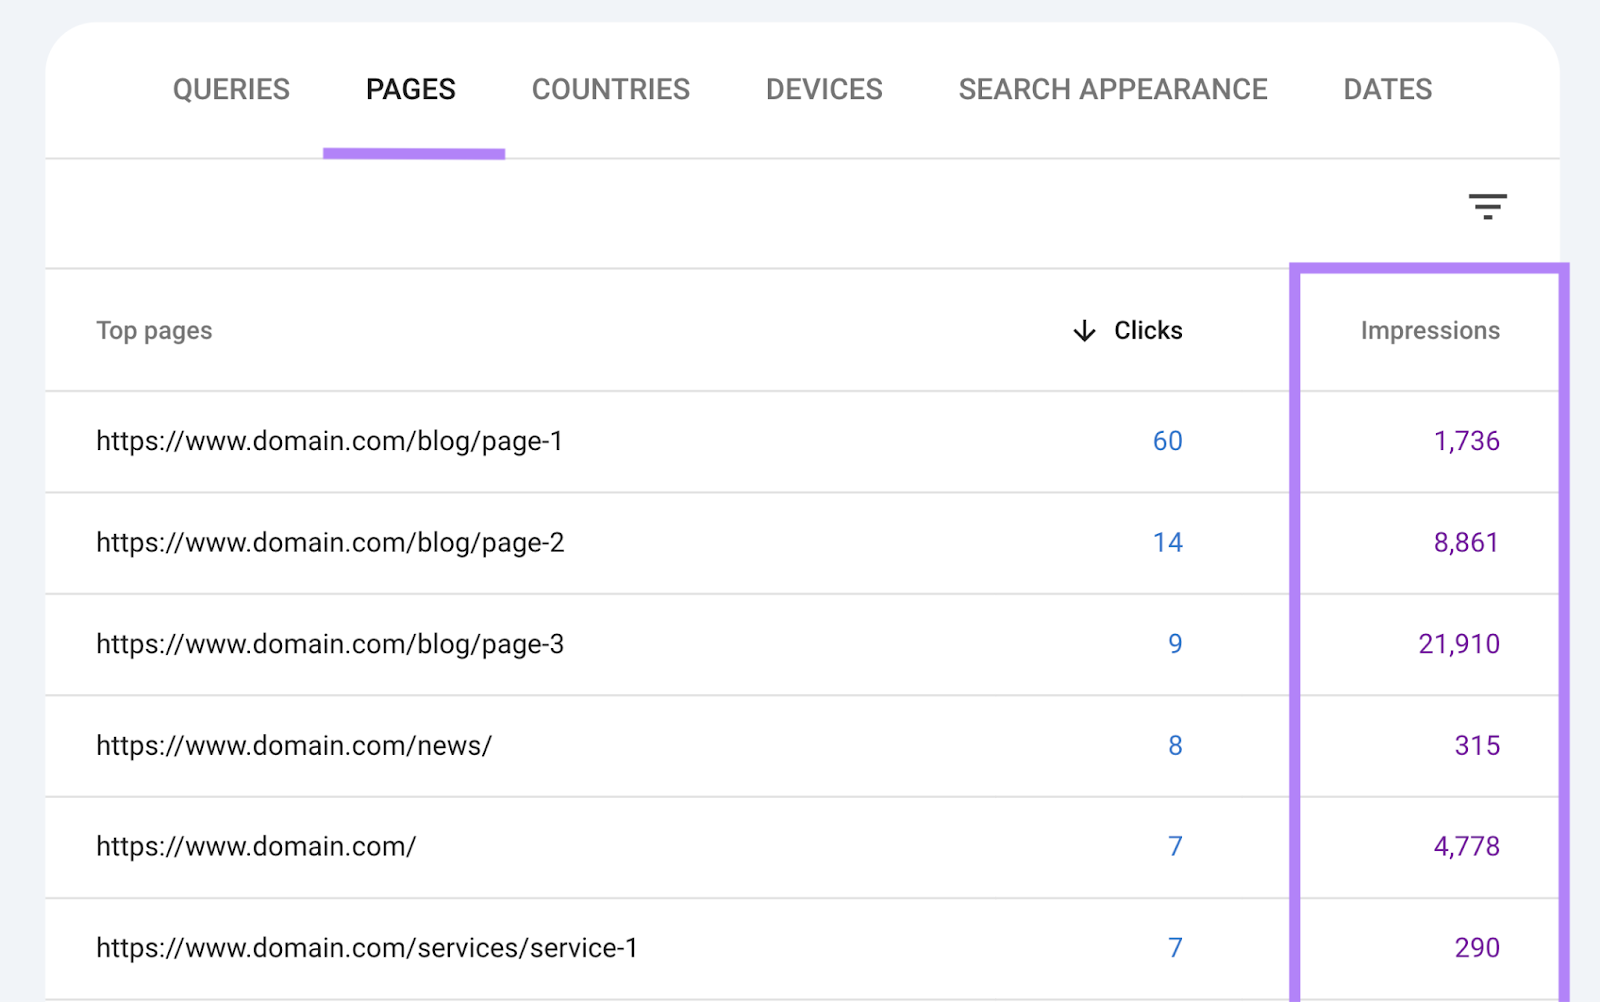
If you’ve taken the steps to optimize your website for SEO, your impressions should increase over time. As your pages start appearing more prominently and for more related queries.
5. Click-Through Rate
Click-through rate (CTR) is the percentage of users who click on your website from the SERP.
It shows how effective your titles and descriptions in SERPs are in attracting searchers’ attention and interest.
And it’s calculated by dividing the number of clicks by the number of impressions, then multiplying that number by 100.
For example, if your site appeared on a SERP 100 times in a month and 10 people clicked on it, your CTR is 10%.
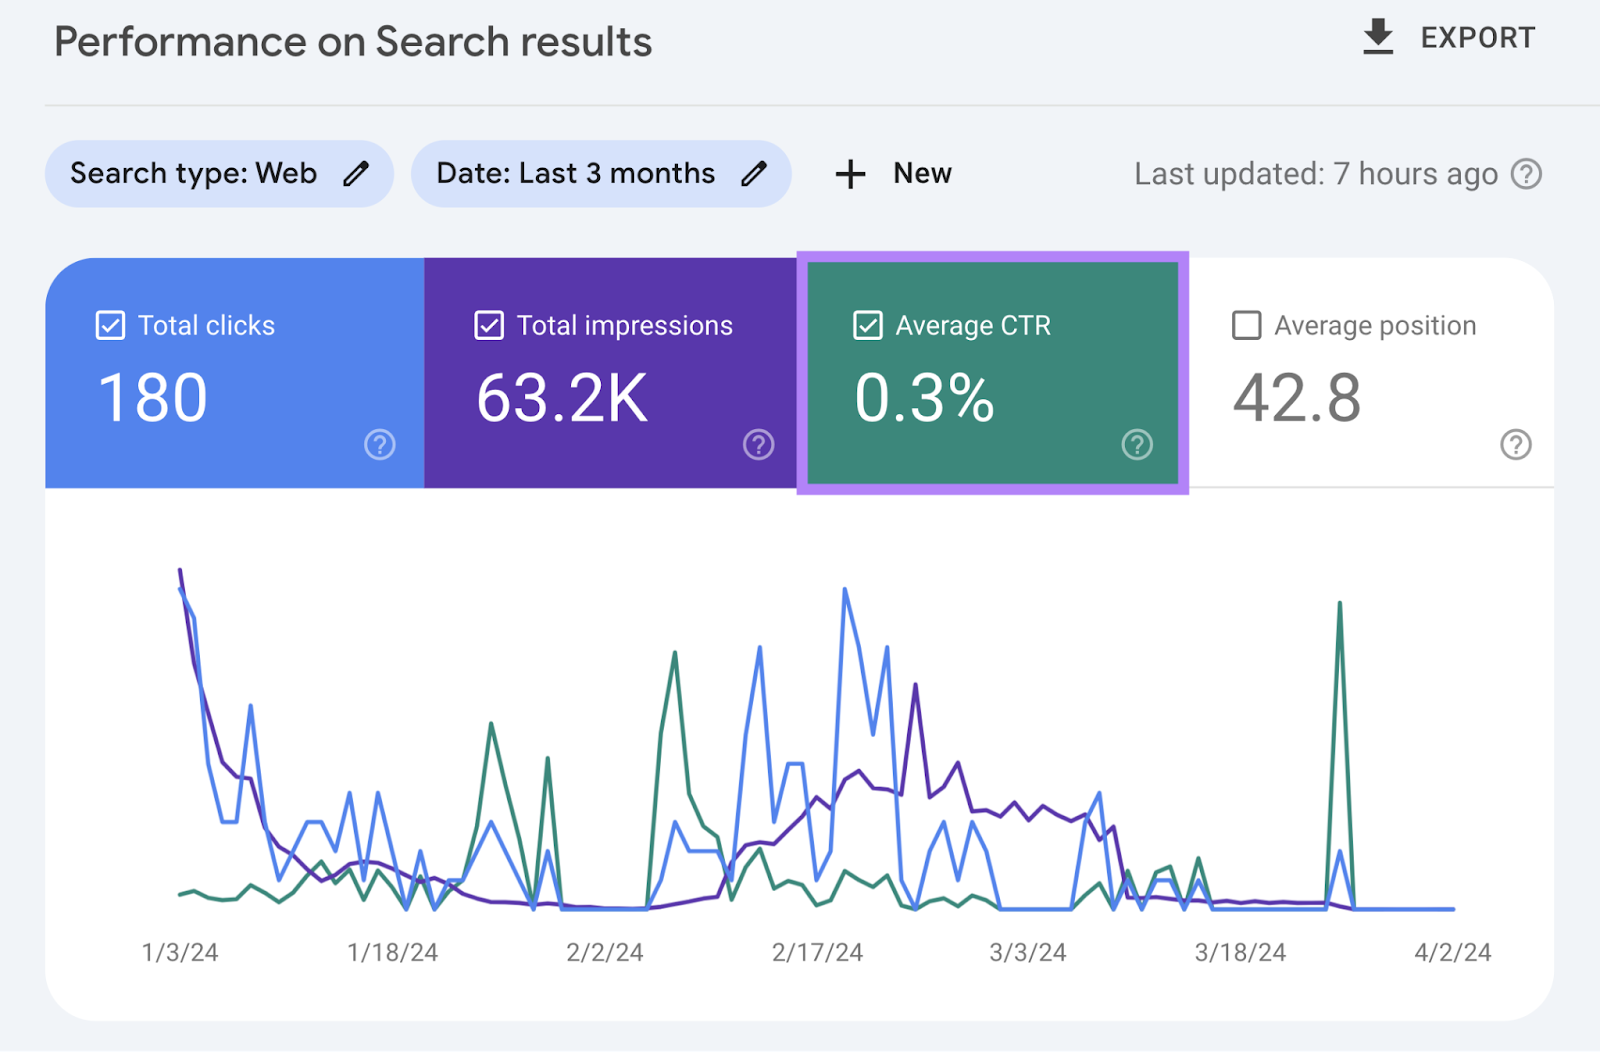
To review your Google CTR, log in to Google Search Console.
Then, click on “Search results” under “Performance.”

Check the box next to “Average CTR” to see your site’s average click-through rate.
You can also check CTR on a page-by-page basis. Scroll down to the table below and switch to the “Pages” tab.
To increase your CTR, consider rewriting your title tags (HTML that specifies your page titles and may appear in search results) to include power words (e.g., “best,“ “free,“ “step-by-step,” etc. ), numbers, or brackets.
And make sure each title tag is 55 characters or less so it doesn’t get truncated in search results.
You can also rewrite your meta descriptions (HTML that provides page descriptions and may appear in SERPs) to try to improve your CTR.
So, ensure you’re using phrases like “find out,” “learn more,” and “dive deep” that can nudge users to click through to your pages.
And make sure your descriptions are brief and contain no more than 105 characters each. To avoid truncation.
6. Conversions
A conversion is when a user completes a desired action on your site—like subscribing to a newsletter, downloading an ebook, signing up for a trial, making a purchase, etc.
If you have high conversions, it means your pages are effective in turning visitors into leads or customers.
In Google Analytics, conversions are called “key events.”
To track your key events, set them up in Google Analytics.
Here’s Google’s guide on creating and editing key events on how to do just that..
And then, you’ll be able to track the organic visits that translate to key events.
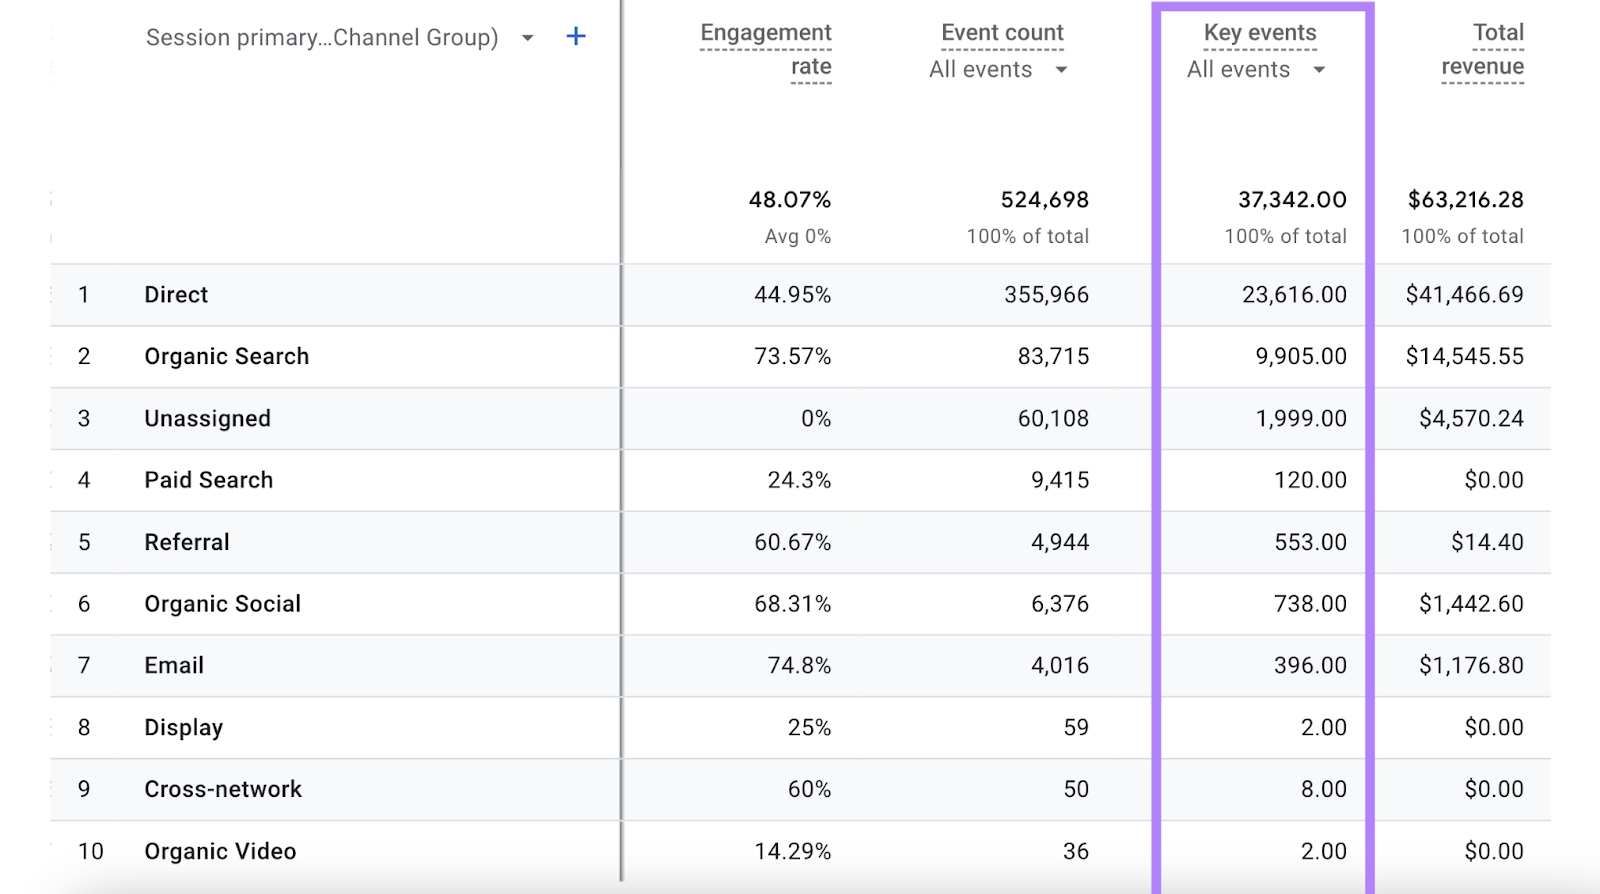
To see your key events, go to “Reports” > “Acquisition” > “Traffic acquisition.”
Now, you’ll see the key event rate for all channels. Including organic search.
Here are some conversion optimization tips to improve your results:
- Use clear and compelling calls to action (CTAs)
- Simplify forms and checkout processes by only asking for essential information
- Leverage pop-ups to capture visitors before they leave
7. Bounce Rate
Bounce rate is the percentage of users who visit your site but leave without engaging—like going to another page or filling out a form.
This specific SEO measurement shows how engaging and relevant your content is for the visitors who land on it.
And monitoring bounce rate can help determine if there are any weaknesses in your SEO approach or website—like slow loading speed, poor mobile optimization, a mismatch between content and keywords, and more.
You can check your bounce rate in Google Analytics.
Open the tool and navigate to “Reports” > “Life cycle” > “Engagement” > “Pages and screens.”
To add bounce rate to the report, click the pencil icon to customize your report.

Select “Metrics” from the “Report Data” section.
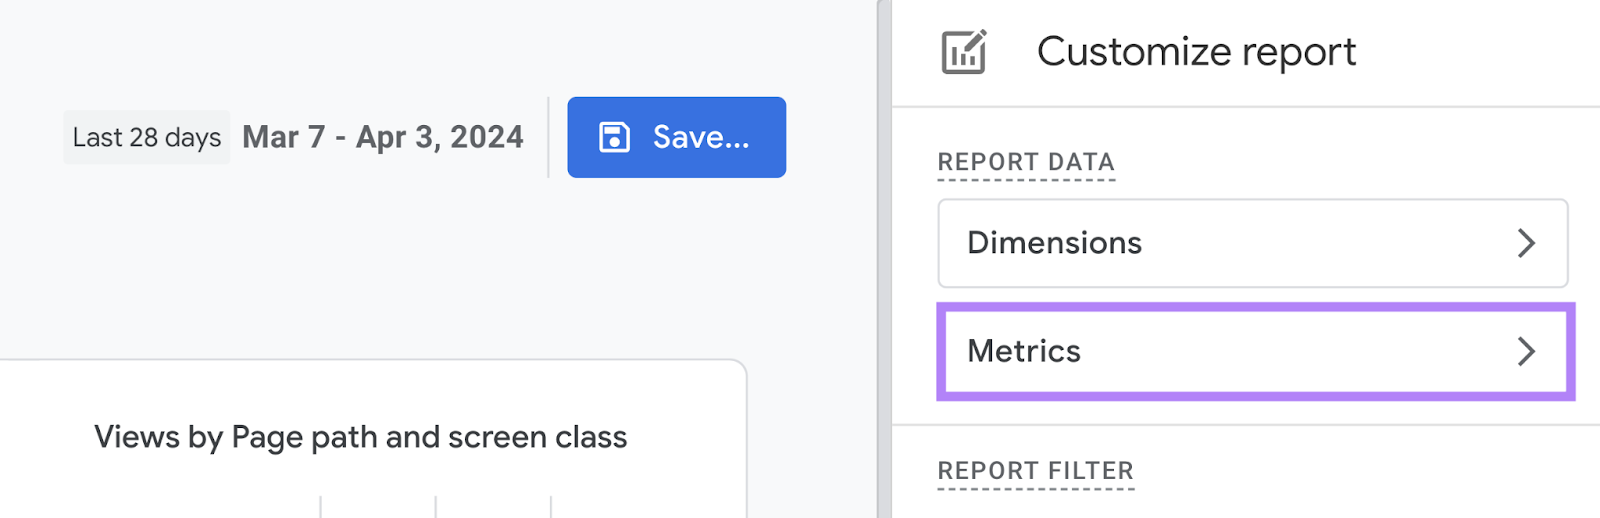
And then click on the “Add metric” drop-down, choose “Bounce rate,” and hit “Apply.”
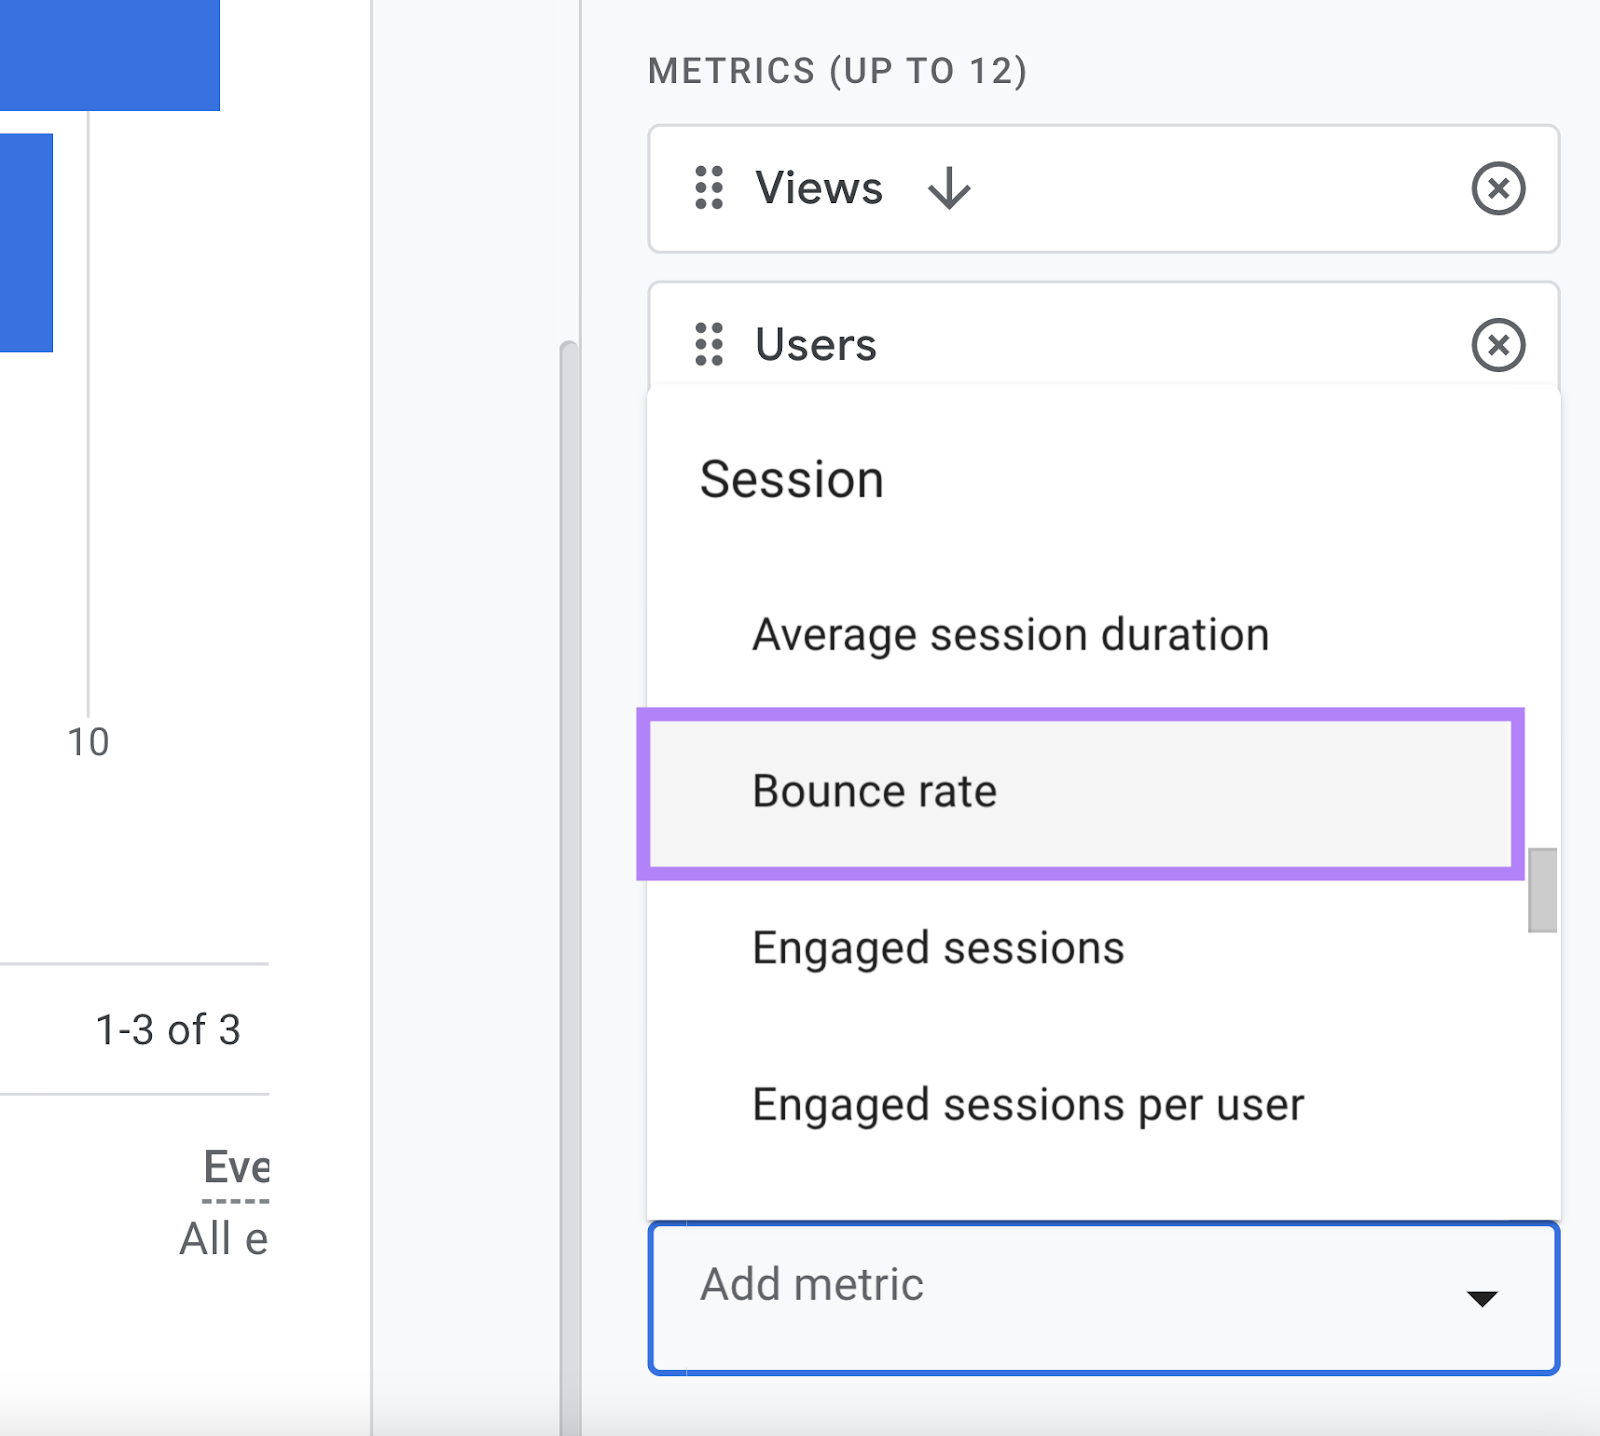
You should now be able to see the bounce rate in your report.
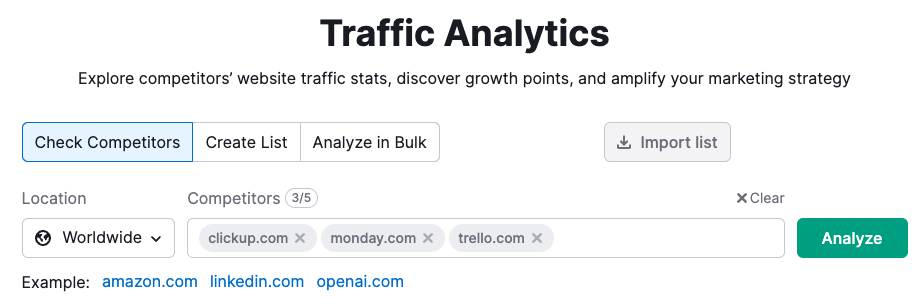
If you want to benchmark your bounce rate against your competitors, use our Traffic Analytics tool.
Open the tool, enter your competitors’ domain names, and click “Analyze.”
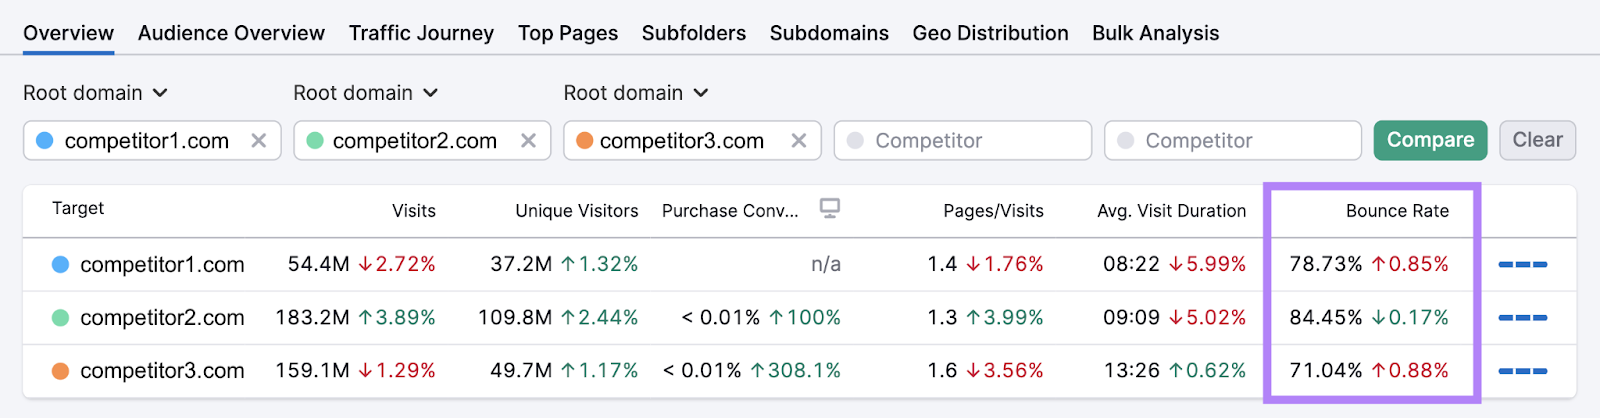
You’ll see a table with the average bounce rates for all the domains. And the difference compared to the previous month.
Like this:
You can also see a trend graph by scrolling down to “Trend by Competitors” and clicking on “Bounce Rate.”
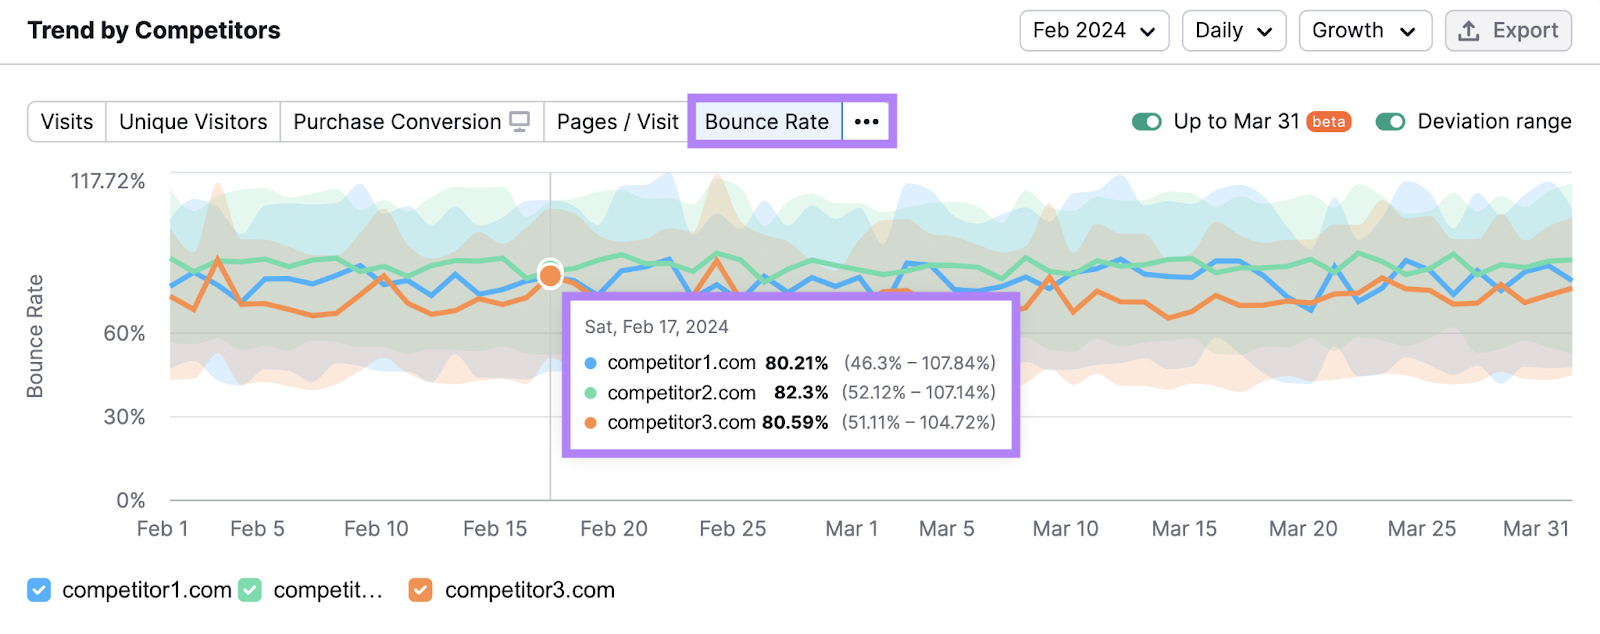
See how you compare. And take steps to improve if needed.
Here are a few tips to help lower your bounce rate:
- Ensure you’re addressing search intent (the main reason why users are searching a term)
- Make your content easy to read and navigate
- Add internal links to other pages on your site
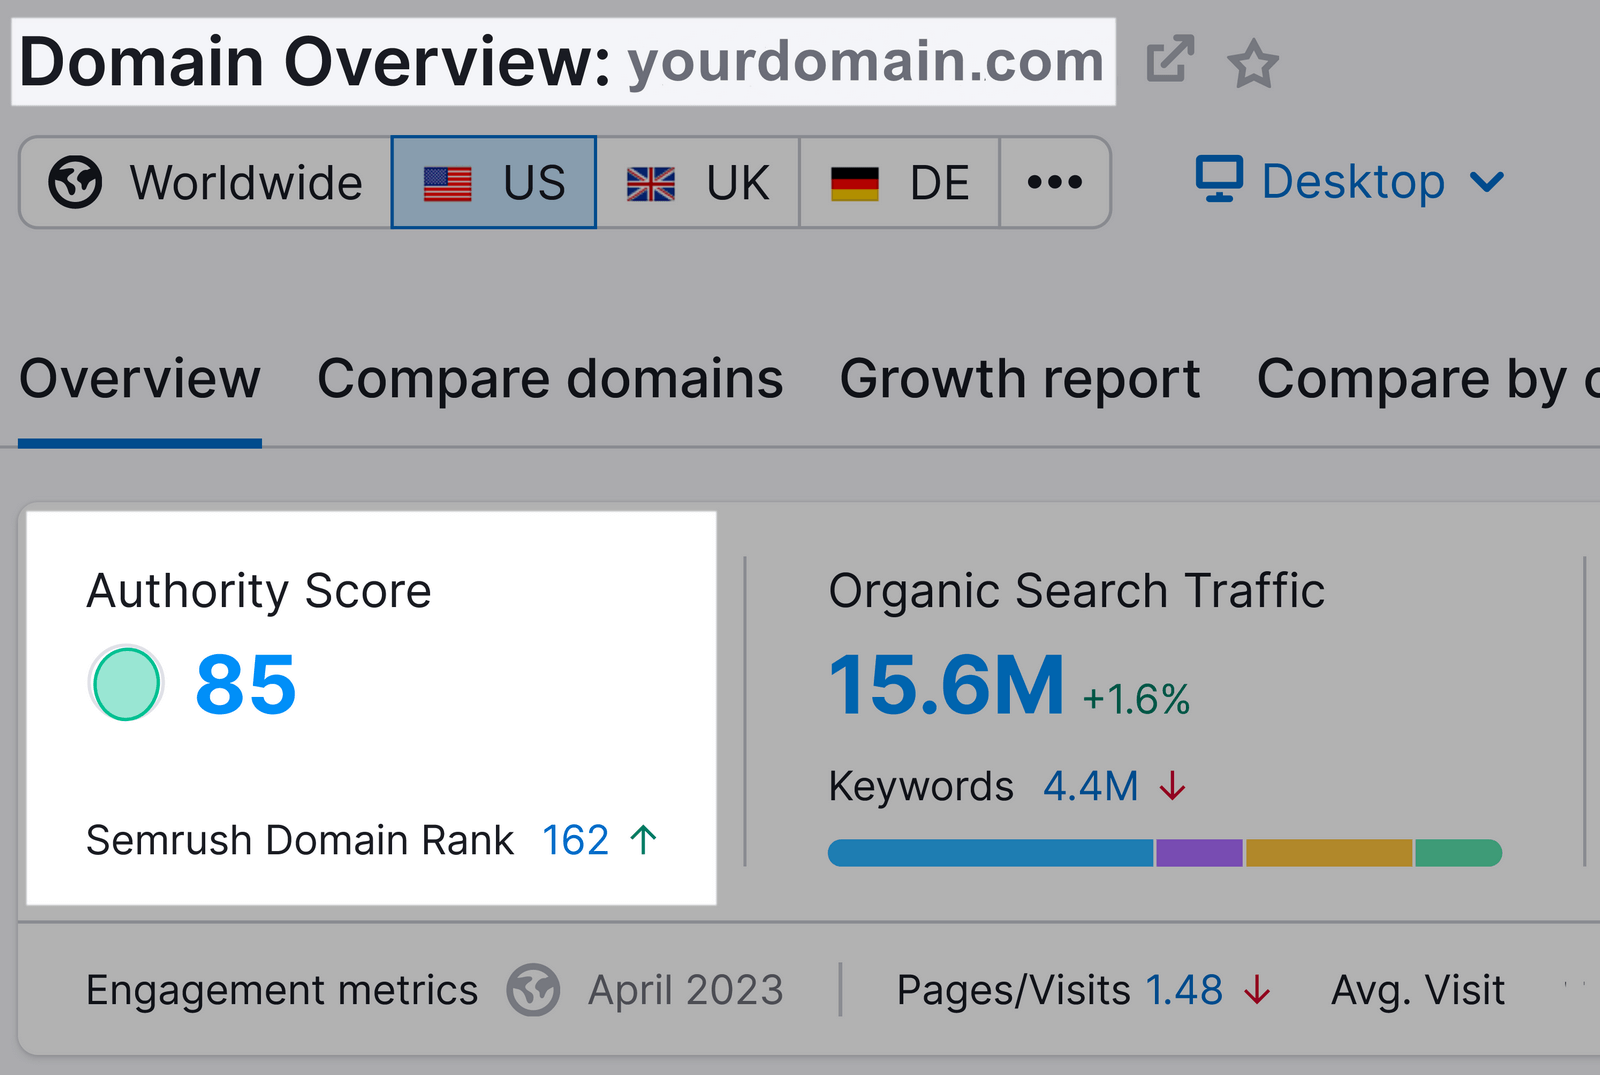
8. Website Authority
Website authority is an SEO metric that predicts how well your website will rank on search engines.
At Semrush, we call this metric “Authority Score.” And it’s based on the quality and quantity of your site’s backlinks, organic search traffic, and other data.
The score is presented on a logarithmic scale of 1 to 100. And the higher your score, the stronger and more authoritative your domain.
You can find any domain’s Authority Score in Domain Overview, Backlink Analytics, Backlink Audit, and the Link Building tool.
To better understand your site’s Authority Score, compare it with your competitors’ Authority Scores.
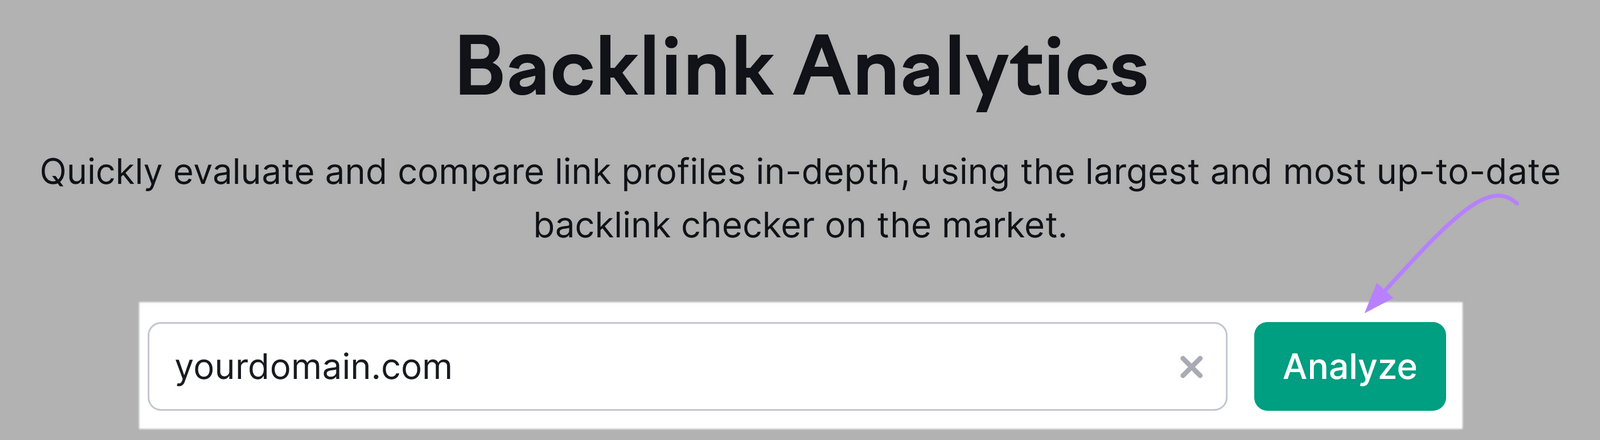
Open Backlink Analytics, enter your domain, and click “Analyze.”
Then, add up to four competitors’ domains and hit “Compare.”
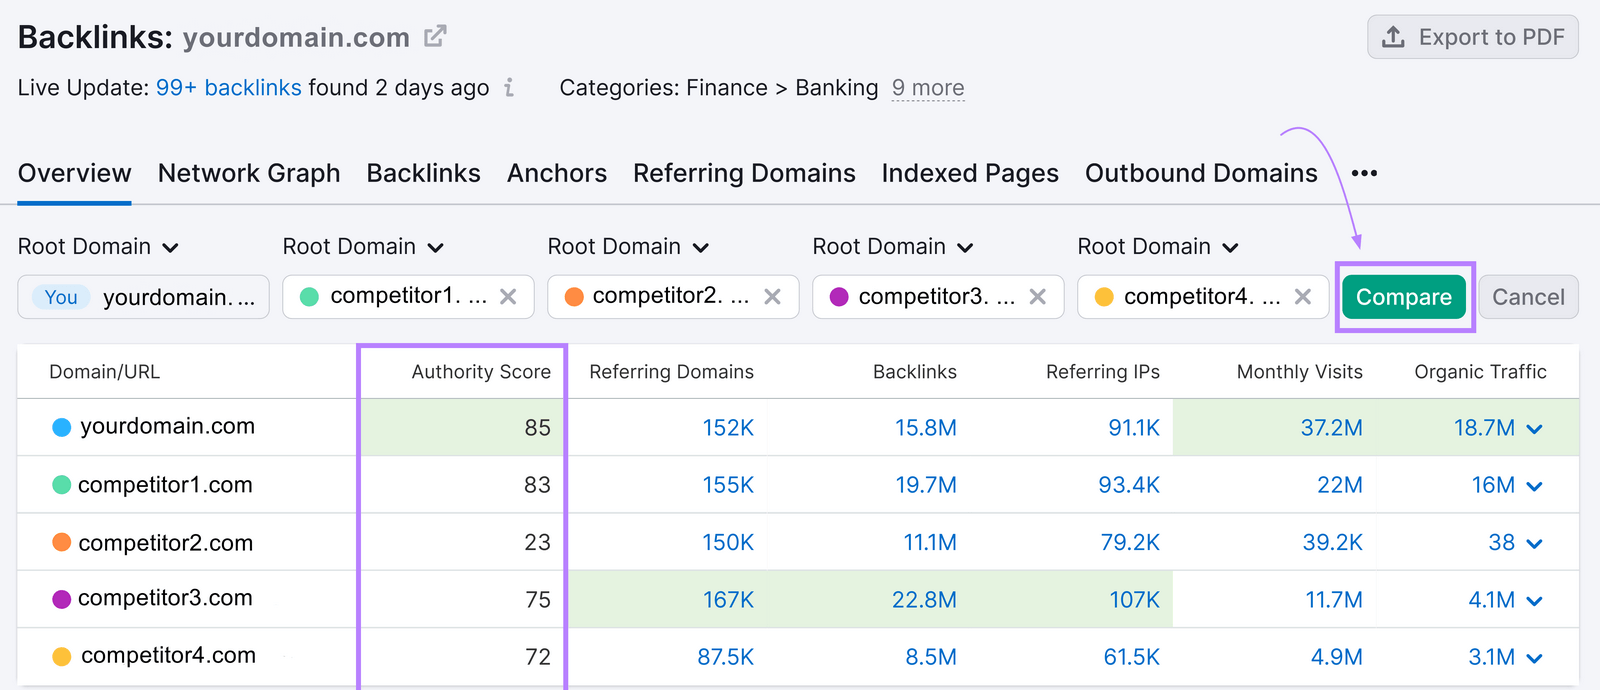
Don’t get too hung up on your exact score. But do work on trying to improve it.
And one of the most effective ways to do that is to build high-quality backlinks to your site.
We’ll get into exactly how to do that in the next section.
9. Backlinks
Backlinks are links from other sites that point to yours.
And they’re one of the most important ranking factors for Google—they help show your site is trustworthy and valuable to others.
Which means:
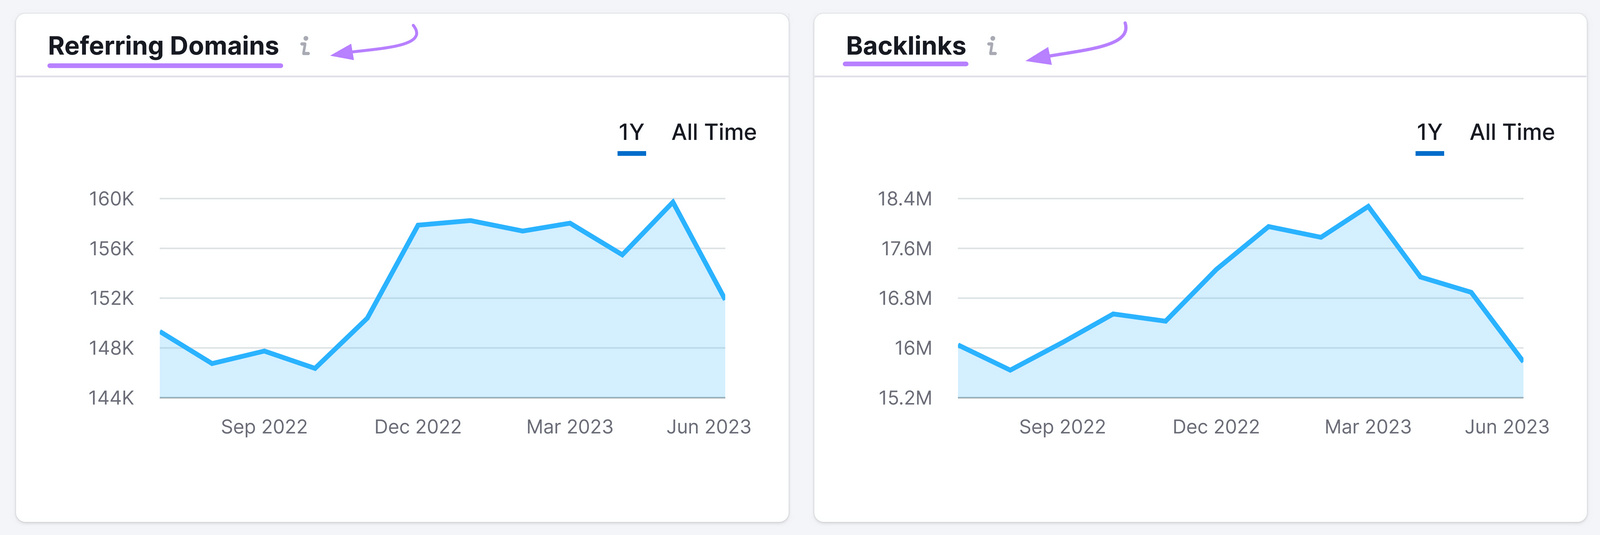
Tracking and monitoring your backlinks is critical. And you can easily do that with Backlink Analytics.
Enter your domain and click “Analyze.”

You’ll get a snapshot of your site’s referring domains (sites that link to you at least once) and total backlinks.
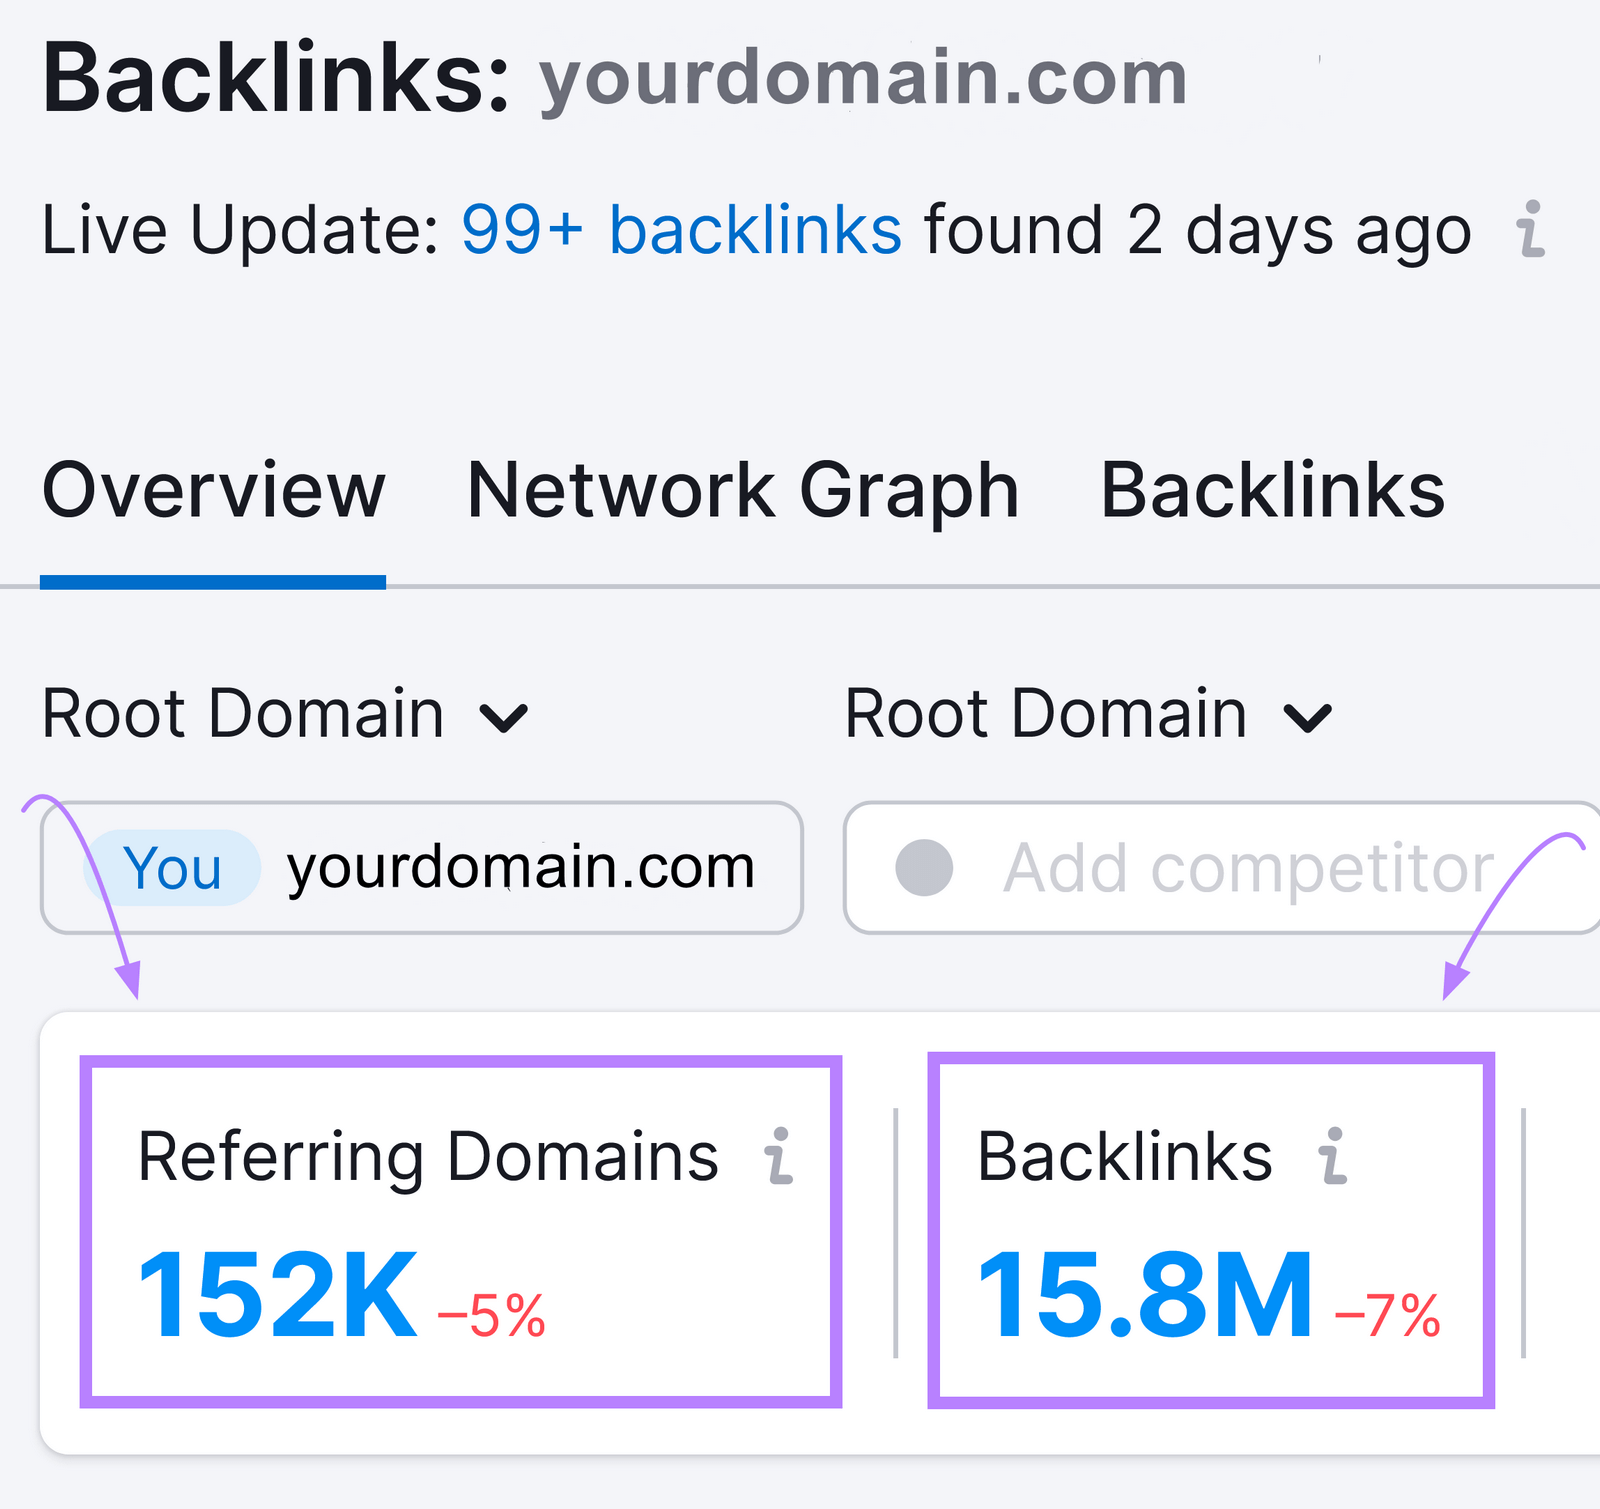
You can also scroll down to see trend graphs for both metrics.
Further down, you’ll see trend graphs for new and lost referring domains and backlinks.
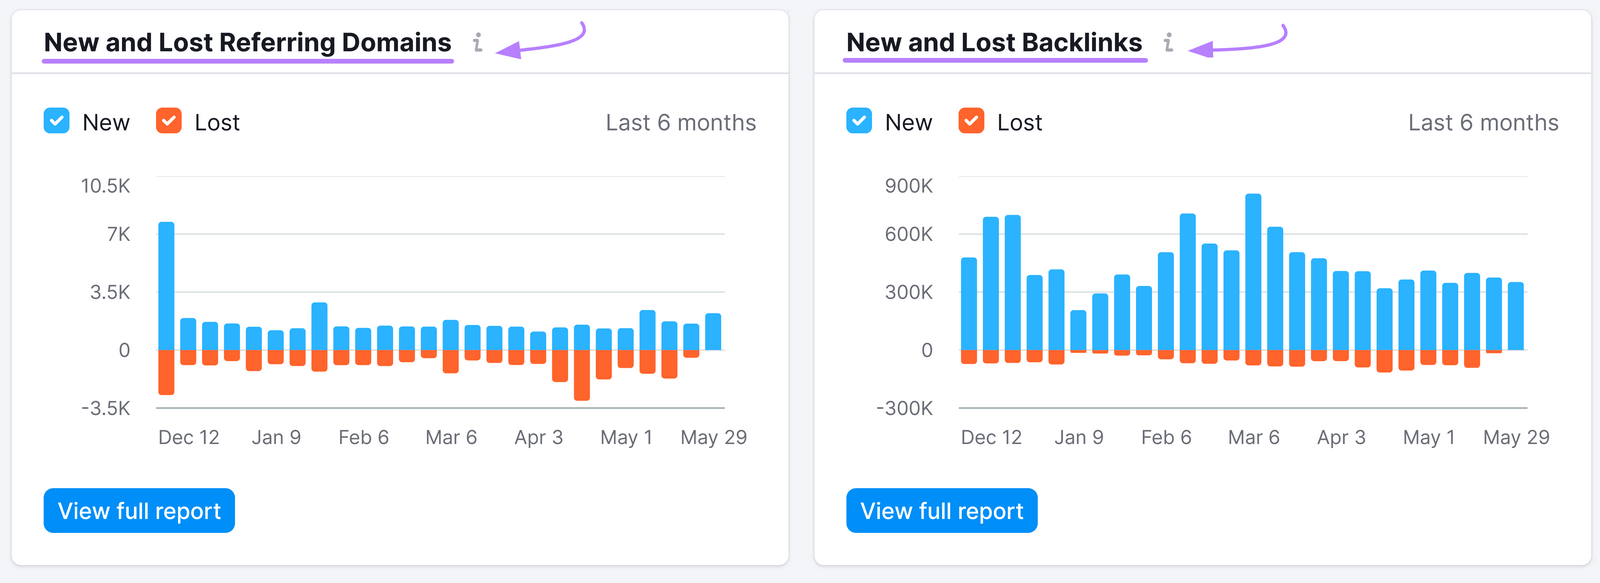
Work on continuously building high-quality backlinks to your site.
Some popular link building tactics include:
- Linkable content: Creating link-worthy assets like infographics, in-depth guides, and original research that naturally attracts links from other websites
- Email outreach: Reaching out to other websites in your niche and asking them to link to your quality content
- Broken link building: Helping web admins find and fix broken links on their site and getting backlinks in return
- Unlinked brand mentions: Asking websites that mention your brand name without linking back to the website to make the mentions linked
10. Technical Health
Having good technical health means search engines can crawl (find) your webpages, index (store in a database) them, and rank them for relevant queries.
It also impacts how fast your website can load and how easy it is to use on mobile devices. And both of these are crucial factors for search engine rankings
But how do you check your website’s technical health?
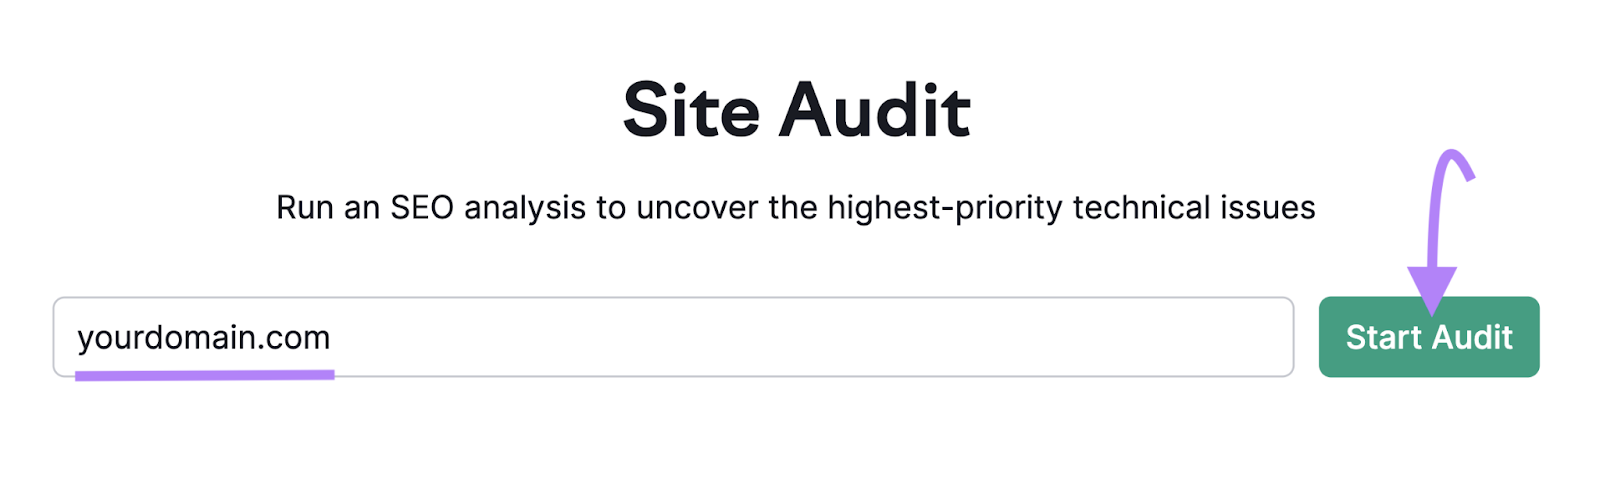
Use Semrush’s Site Audit tool.
Open the tool, enter your domain name, and click “Start Audit.”
Then, use the configuration guide to set up your audit.
After it’s done, you’ll see a dashboard like this:
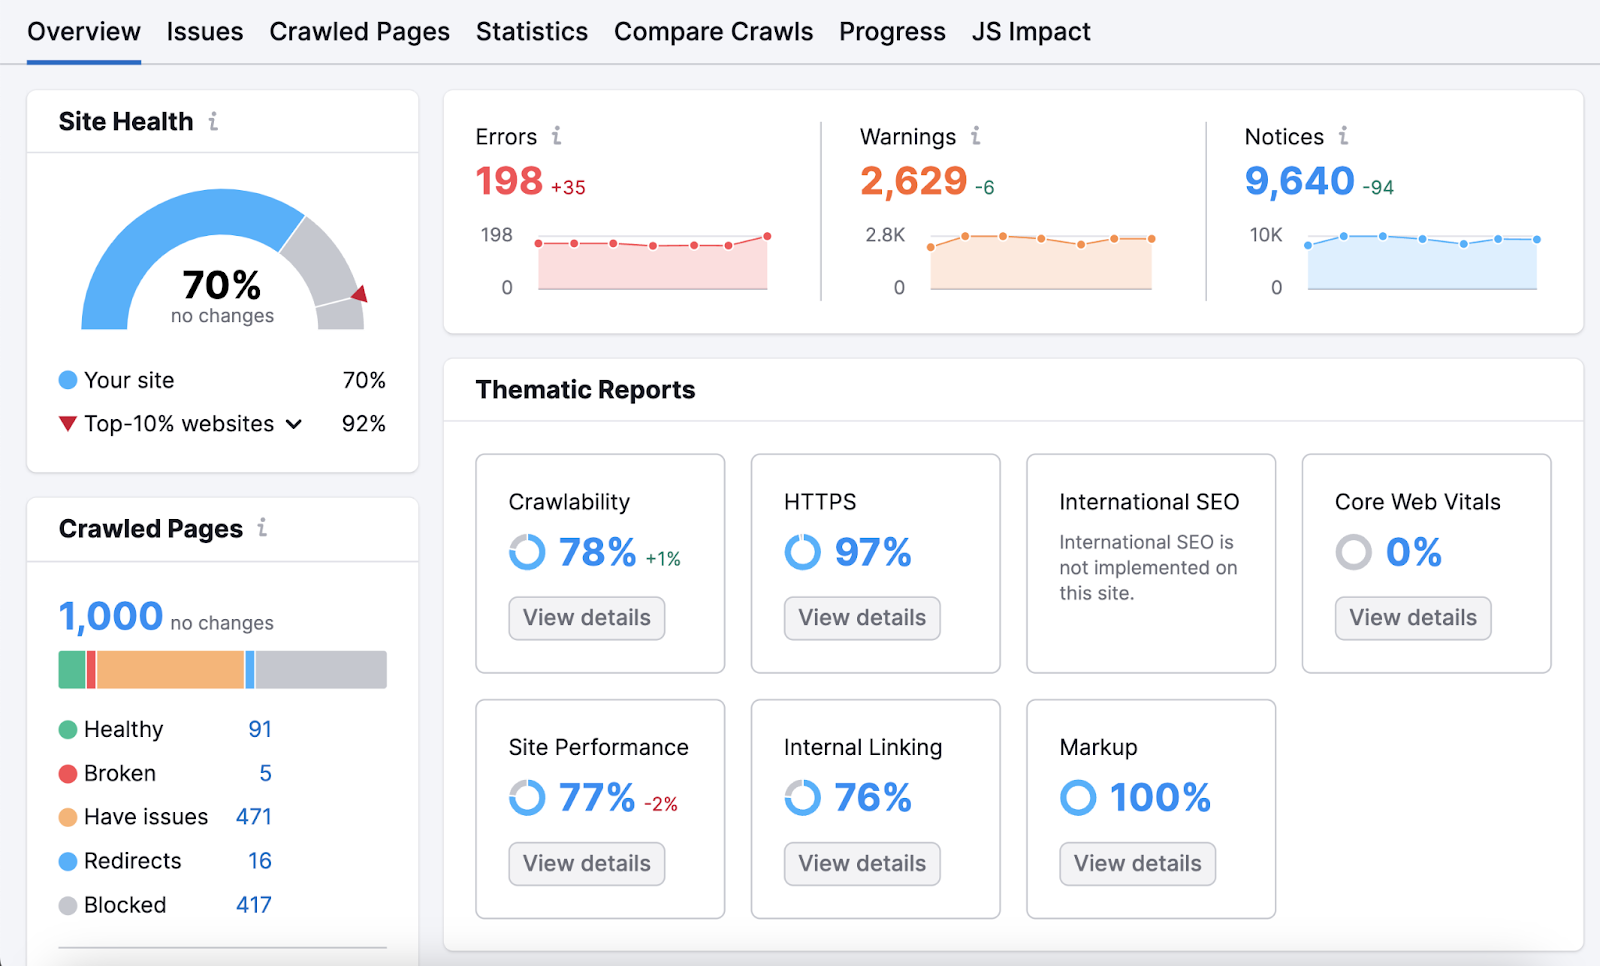
Notice your Site Health score (also called an SEO score or technical health score). It measures your site’s overall health based on the number and severity of the issues the audit uncovered.
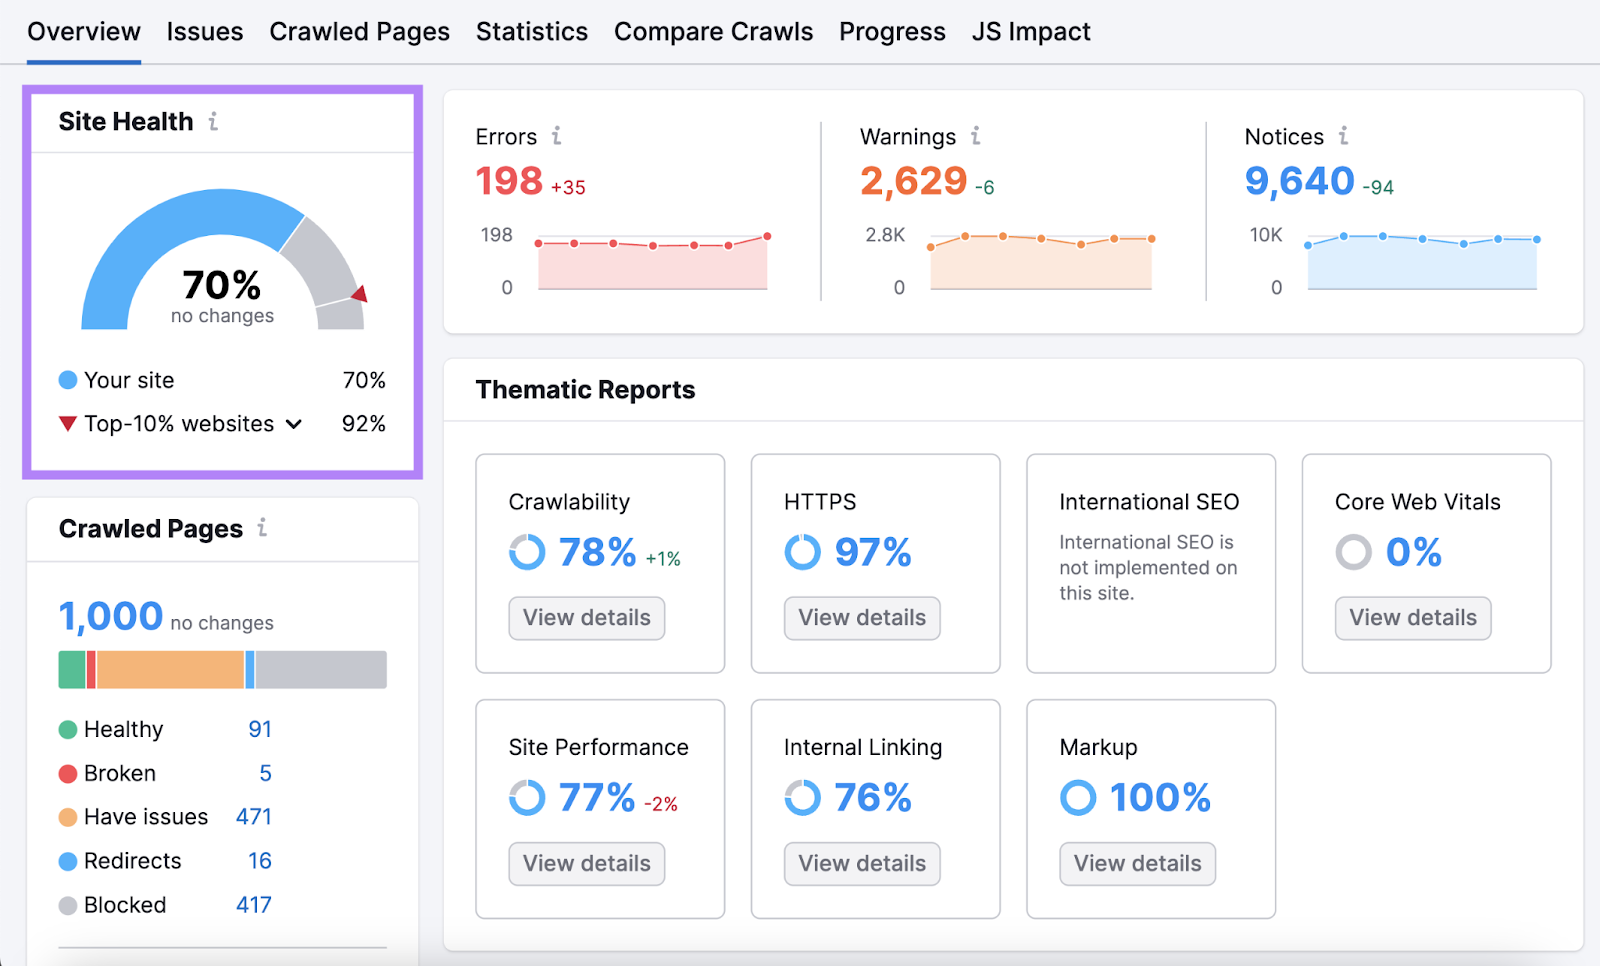
The higher the score, the fewer critical issues your site has. And better it will likely rank in search results.
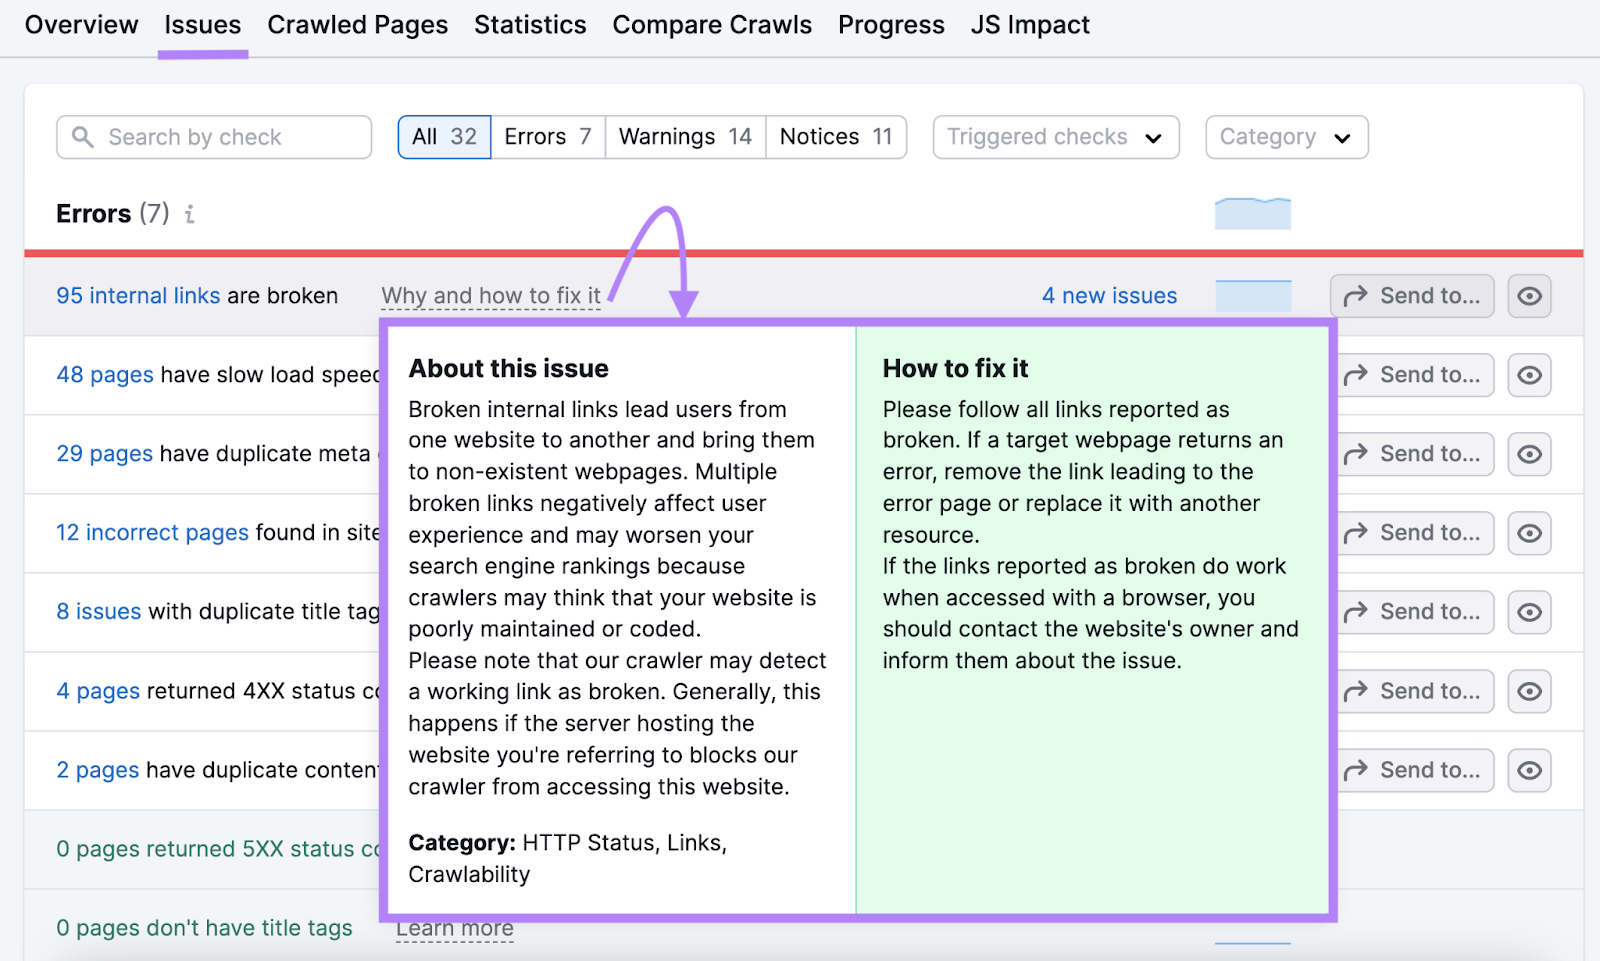
Next, click on the “Issues” tab. You’ll see all the technical issues listed one by one.
Work on fixing them. And if you’re not sure how, click the “Why and how to fix it” link next to the issue for a quick explanation.
11. Engagement Time
Engagement time (sometimes called time on page) is the average amount of time your webpage was the user’s main focus.
It’s a helpful metric to see how well your content meets search intent. Which is important for SEO.
When a searcher types a keyword into Google, lands on your page, and spends a lot of time there, it suggests that your site satisfied their intent.
They found what they were looking for. And it was useful.
On the other hand, a low time spent on a page can indicate a mismatch between what the user was looking for and what your page contains.
(However, engagement time is not a perfect measure of content usefulness or whether you’ve satisfied search intent. For some queries, engagement time will naturally be low.)
In any case, you can track the average time visitors spend on your site using Google Analytics.
Log in to your GA4 account and go to “Reports” > “Engagement” > “Pages and screens.” You’ll see the metric under the column “Average engagement time.”
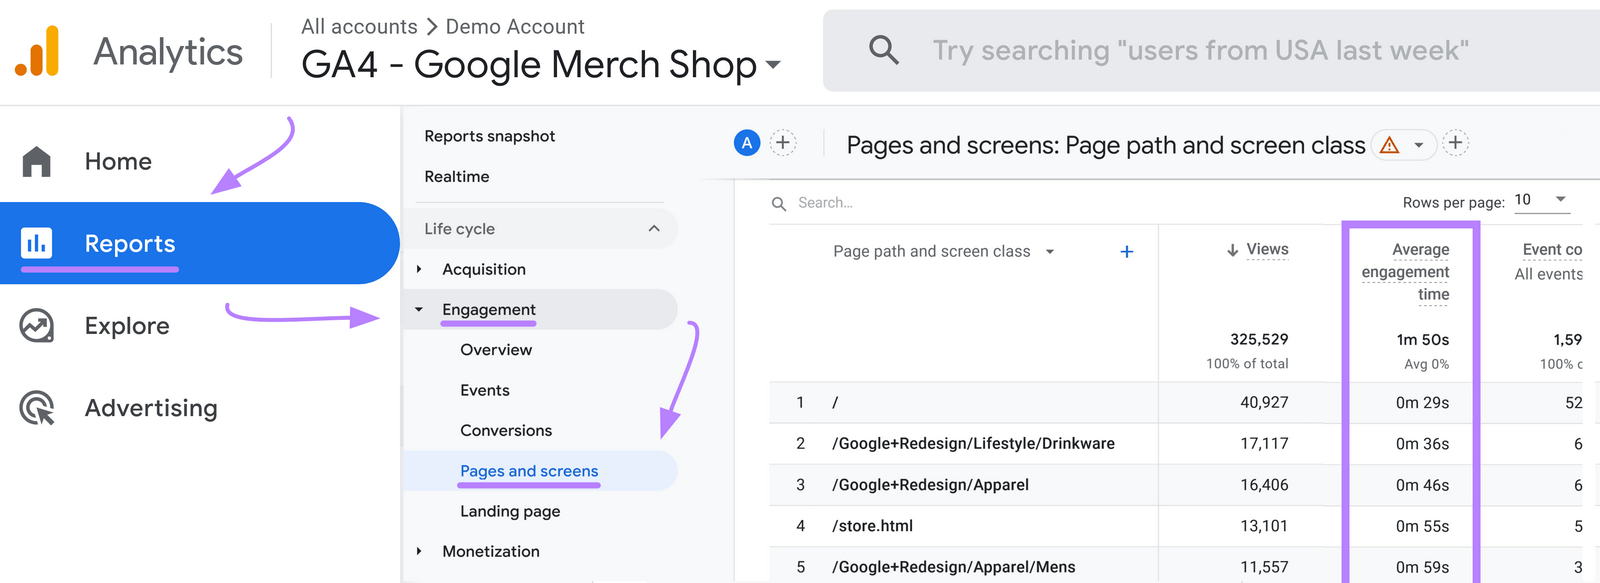
Pages that have a notably lower number are worth investigating.
And an easy way to determine search intent is to run the page’s target keyword through Keyword Overview.
You’ll see its search intent in the “Intent” box.
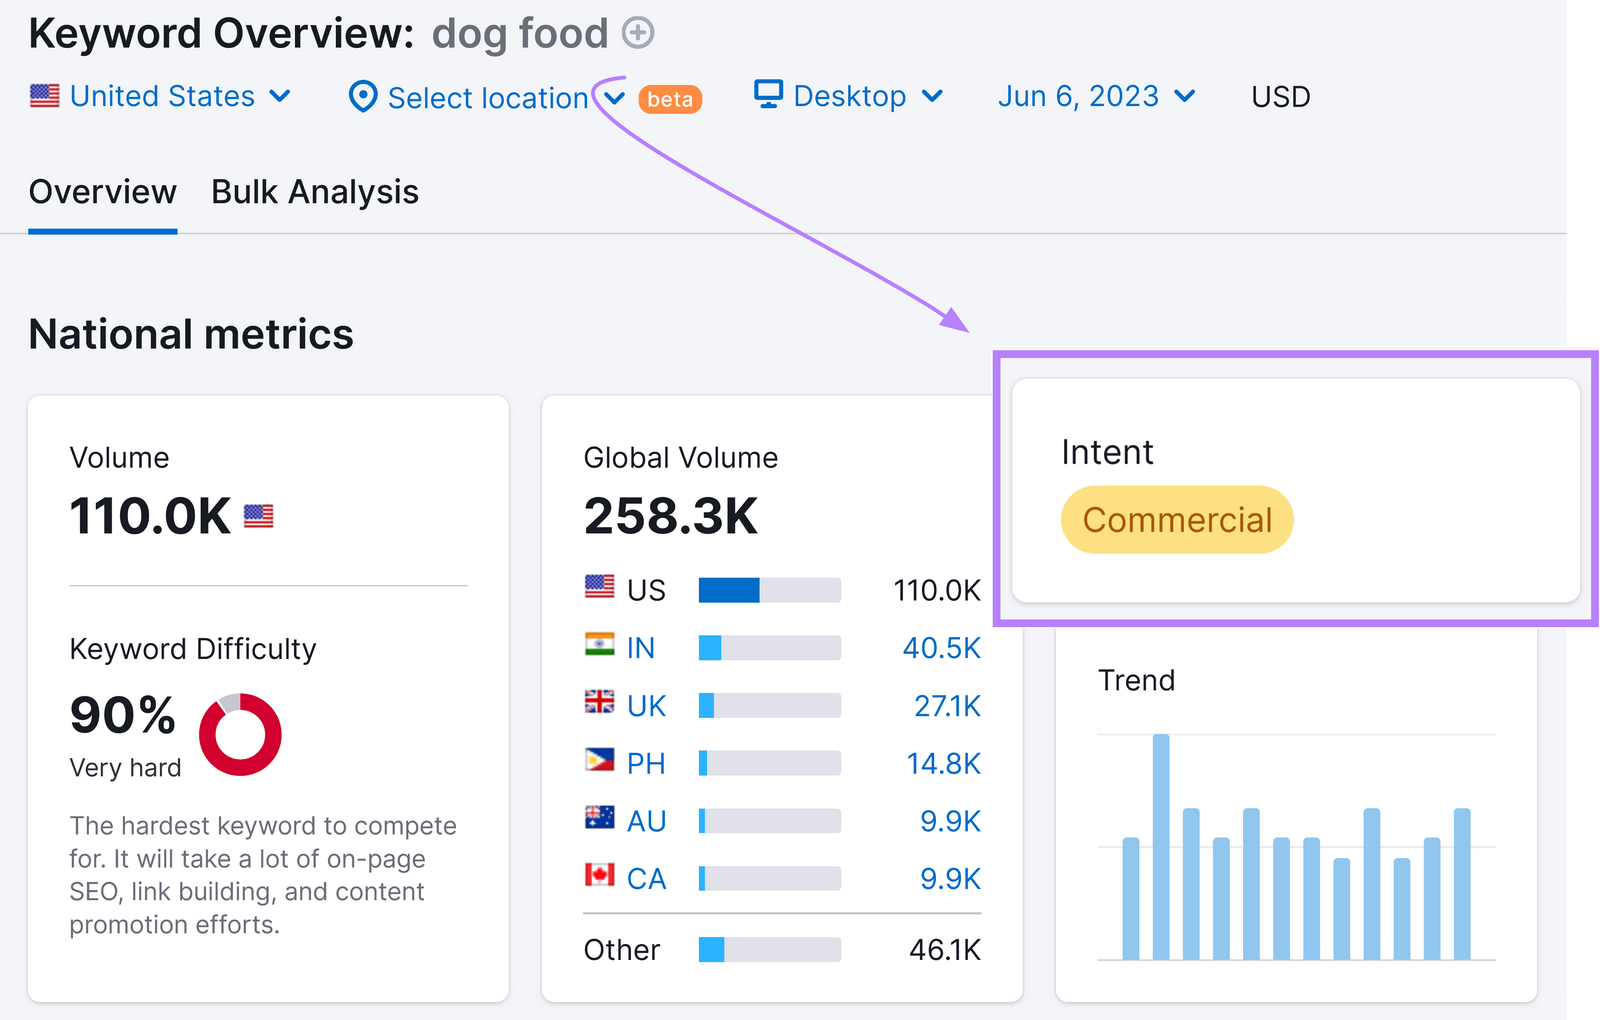
Then, ensure your pages’ content meet the right type of intent.
How Long Does It Take to See SEO Results?
It takes a noticeable amount of time to see results with SEO.
So, treat SEO as part of an ongoing project that will never be complete.
Your timeline for seeing results will also depend on how new your site is, how good your SEO strategy is, and how consistent you are in implementing your tactics.
If you have all that going for you, expect to start seeing results within four months to a year.
Remember that your website’s visibility and rankings will be heavily influenced by who your competitors are and what keywords you’re trying to rank for.
To know if you’re making progress, track results and refine your strategy as data comes in.
Over time, you’ll see it pay off. Prioritize sustainability over speed. And you’ll enjoy the rewards for longer.
Further reading: How to Get Faster SEO Results
Evaluate Your SEO Performance
Now that you know how to measure SEO performance, it’s time to take it a step further and try for yourself.
Open your Google Search Console, Google Analytics, and Semrush accounts. And start monitoring your SEO effectiveness.
If you haven’t yet signed up for a free Semrush account, now is the time.
Get started today.