Why is there limited or no data in Traffic Analytics for the website I entered?
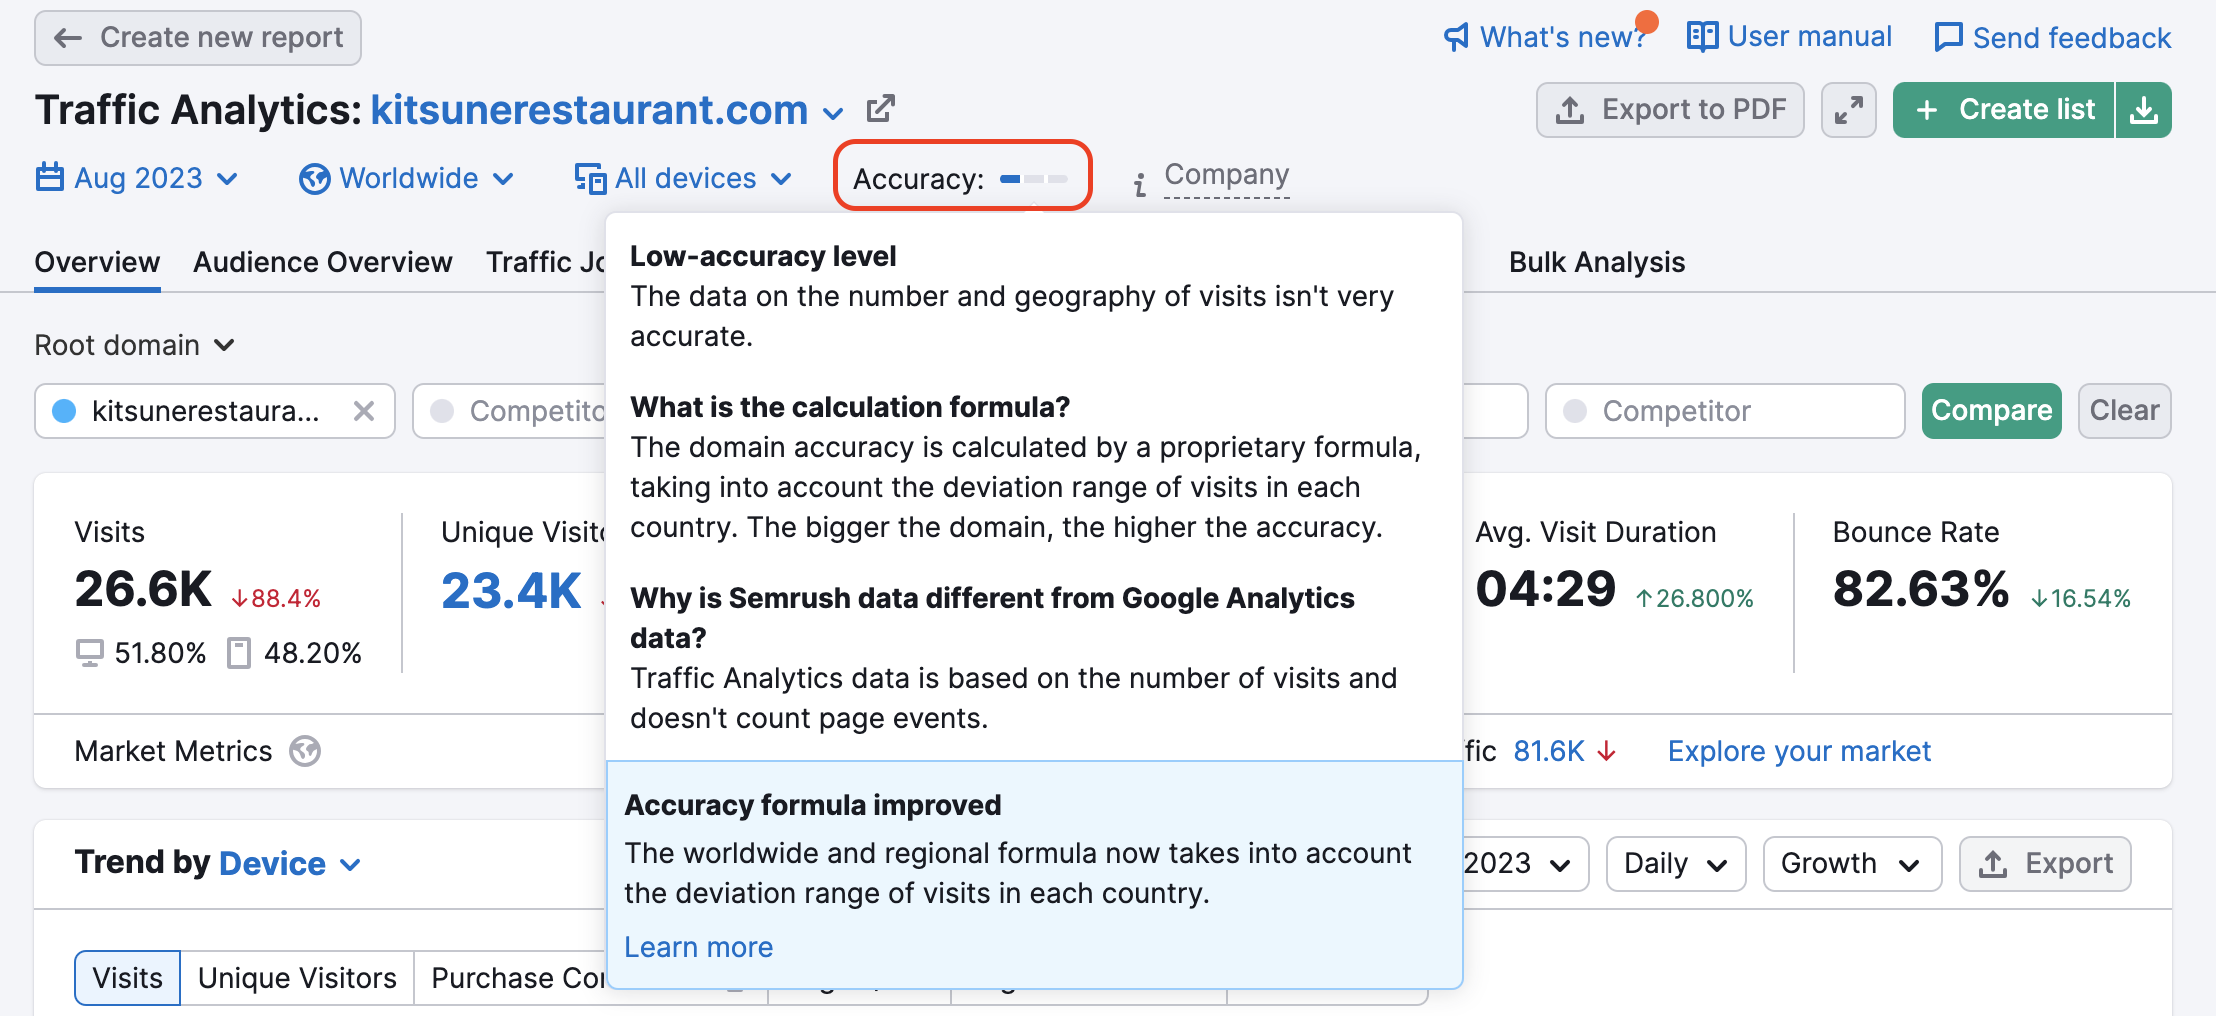
Traffic Analytics offers the accuracy metric to help you understand the amount of variability in the traffic estimates we provide. Domains receive one, two, or three bars on the accuracy scale.
Domains that show three bars on the accuracy scale have the highest level of confidence in terms of traffic estimates. Domains with two bars show some fluctuations in their estimates, while domains with one bar have more fluctuations.
The term ‘high fluctuations’ means the deviation range on either side of the provided estimate is broader.
Check the Accuracy metric at the top of the report to gauge the amount of variability in the provided traffic estimates.
If you discover a graph with limited data or gaps in the data, check if the information is available for another location, device type, or month. Availability can vary depending on these parameters.
Look at the chart and check how the traffic flow changed during the last 12 months. If you see dotted gray lines on the chart, this either means that the website doesn’t receive much traffic or our sample of data for this site is small.

Hovering over the line in the graph will show you the deviation range, which will be smaller for domains that show three accuracy lines and larger for domains with two or one bar.
- What is the difference between Semrush Traffic Analytics and Google Analytics?
- Why is there limited or no data in Traffic Analytics for the website I entered?
- Why are different traffic values shown in Domain Analytics and Traffic Analytics?
- What’s the difference? Position Tracking Pages vs. Traffic Analytics Top Pages
- How to Create a Custom Traffic Analytics PDF Report
- Traffic Analytics Overview Report
- Traffic Analytics Audience Overview Report
- Traffic Analytics Traffic Journey Report
- Traffic Analytics Top Pages Report
- Traffic Analytics Subfolders Report
- Traffic Analytics Subdomains Report
- Traffic Analytics Geographic Distribution Report
- Traffic Analytics Bulk Analysis
- Traffic Analytics Filters