In the Top Pages report, you are able to take an in-depth look at a company’s digital marketing strategy. The report shows specific metrics of up to a site’s top 1000 pages* based on traffic.
*Depending on the domain
In this report, we define top pages as the pages with the highest number of unique visitors.
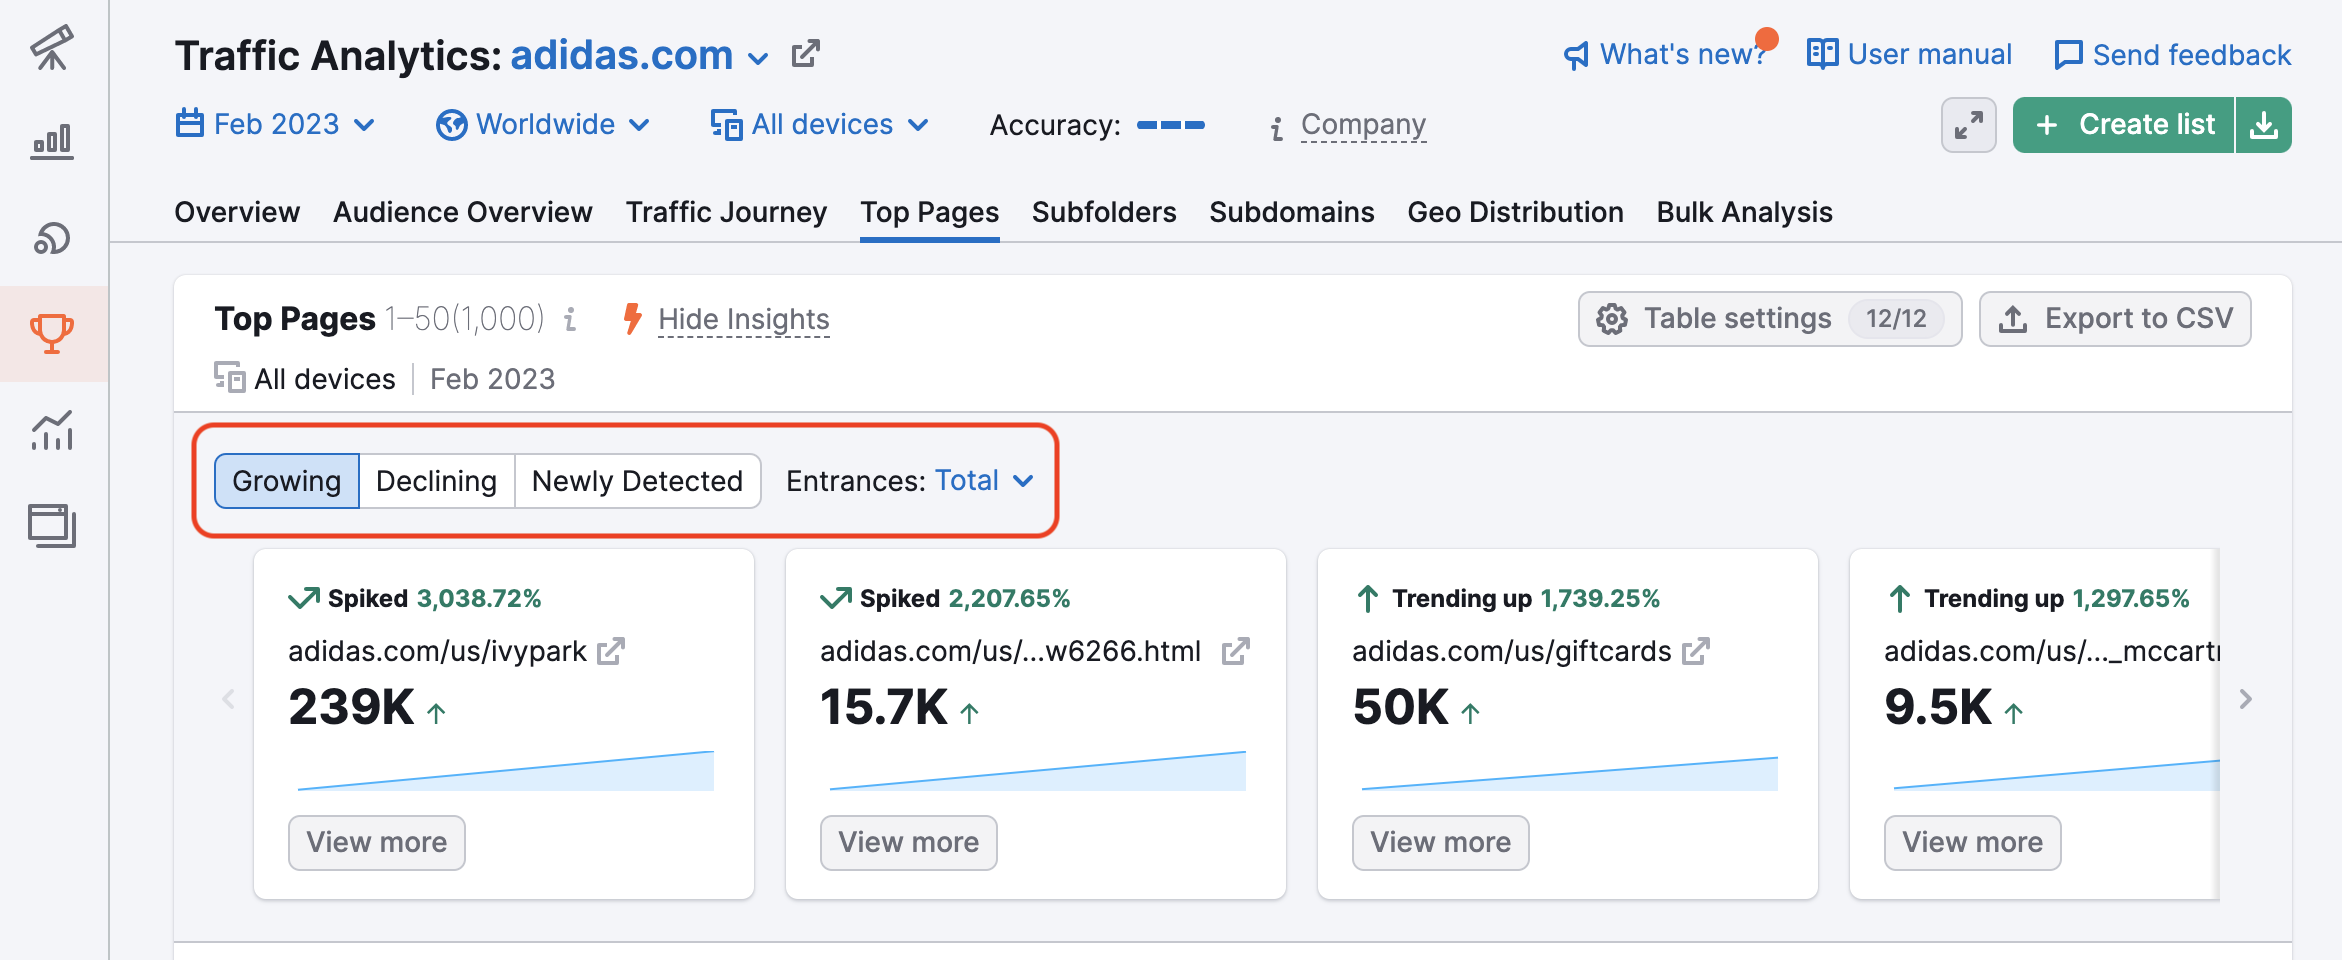
The Insights widget occupies the first section of the Top Pages report. You have the option to show or hide insights by clicking the “Show insights” or “Hide insights” text element at the top of the page.
The Insights section of the report lists pages on your selected domain that are newly detected, declining in traffic, or growing in traffic. Using the tabs in the upper left corner, you can filter the cards by Growing, Declining, or Newly Detected.
You can also filter by traffic type using the Entrances drop down text element. By clicking the “view more” button shown on each card, the tool brings that page to the forefront of the pages list (shown below).
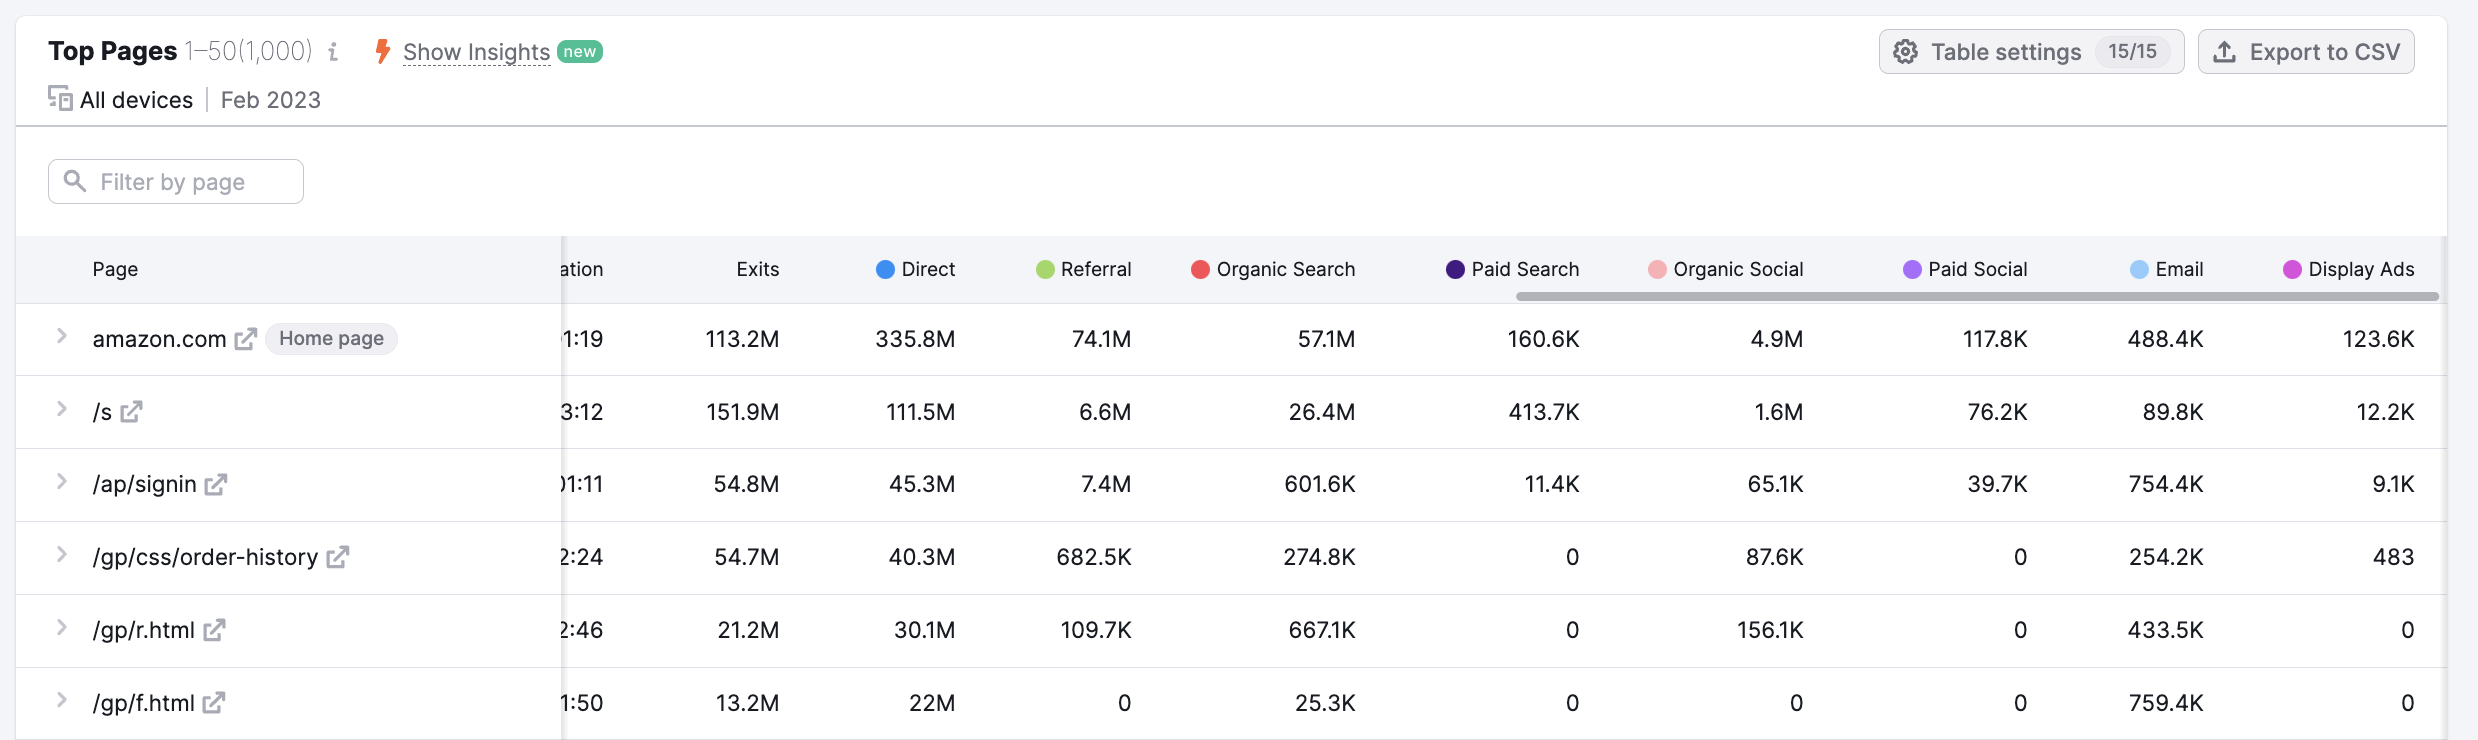
Below the Insights section, the tool lists each page on the website. For each page, you can view the traffic share, 1Y traffic trend, the number of unique page views, unique visitors, entrances, and traffic channels (direct, referral, organic social media, paid social media, organic search, paid search, email, and display ads).
Let’s define at each of these metrics individually:
- Traffic Share – The percentage of a domain’s total traffic driven to a specific page.
- 1Y traffic trend – Changes in a specific page traffic over the previous 12 months.
- Unique page views – Unique page views are measured by the number of visits in which that page was viewed at least once.
- Unique visitors – Unique visitors are the total number of unique visits to a given page.
- Entrances – the number of visitors who arrived on the page from an external source. In other words, the visitor entered the website through this page.
- Exits– the number of sessions that came to an end on a given page. In other words, the visitor exited the website from this page.
- Traffic channels – the number of visitors who entered the page through the various channels (direct, referral, organic social media, paid social media, organic search, paid search, email, and display ads).
You can analyze this data even further when you apply filters: time period (Historical Data filter) and country of origin (Location filter).
Let’s say for example you are analyzing an e-commerce company that your site competes with. By examining their page metrics, you can gather insights such as:
- Which of their products are the most popular amongst their visitors.
- Which channels are driving the most traffic to each page.
- Which landing pages they’re actively promoting.
- Which pages are gaining or losing traction.
The top pages report allows you to view data on subdomains, as well as root domains.
You can dive deeper into the top pages by expanding them. All you need to do is click on the pages column or the drop-down arrow to the left.
This gives you a breakdown of each page’s sources of traffic and historical trends for unique pageviews and visitors. In addition, the sources of traffic will be broken down into percentages.
Your entrance sources will show you how much of a competitor’s page’s traffic comes from direct, referral, organic social media, paid social media, organic search, paid search, email, and display ads channels.
Using the search box, you can filter your list of top pages for a specific topic. This can help find a competitor's pages related to a specific topic only. For example, you can find whether adidas.com has other pages related to the Yeezy brand.
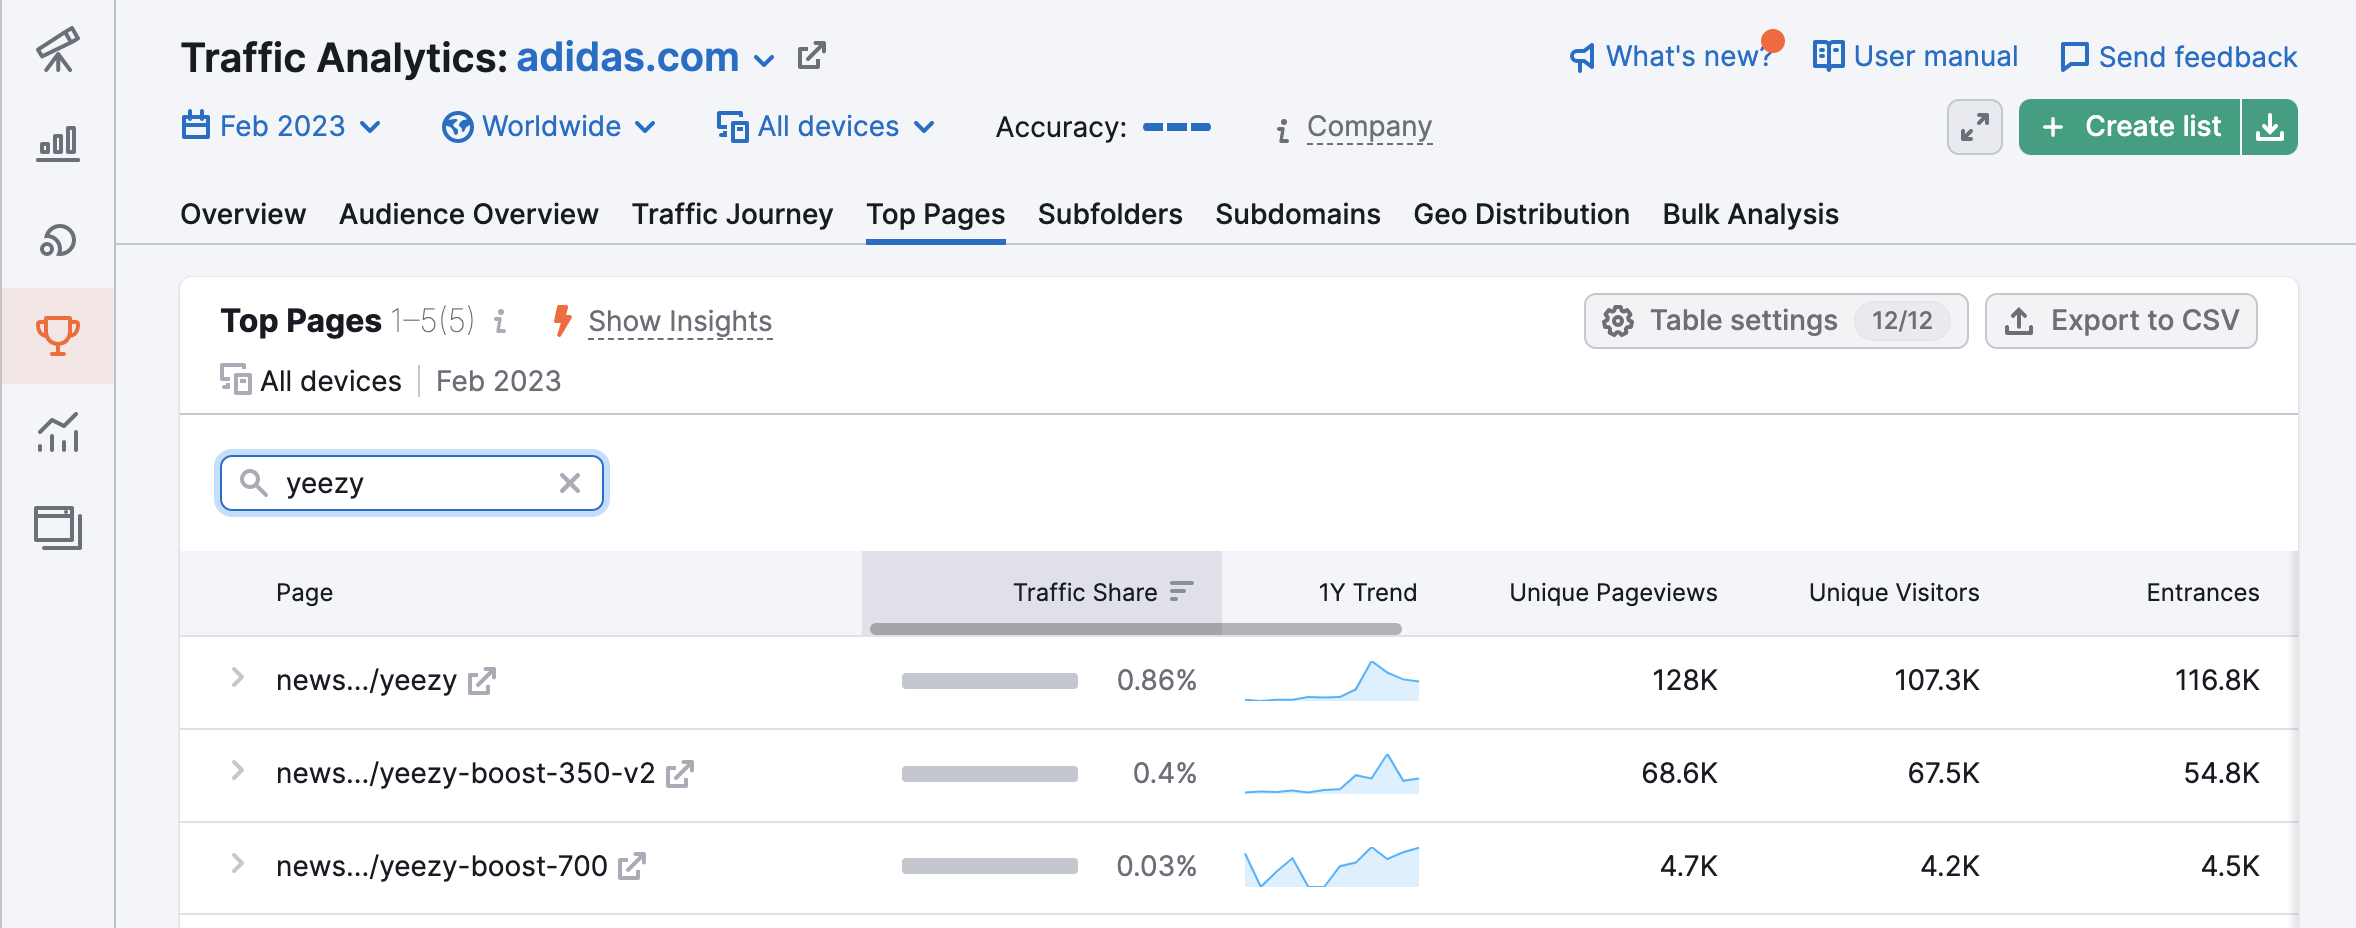
This way, if you are only interested in, let's say, a specific product of your competitor, you can type your query into the search bar and find exactly the pages related to your query.
Once you’ve brought your search into focus, you can analyze the Traffic Share and 1Y Trend of the pages to see if they’re being promoted or gaining traction, and look at Unique Pageviews, Unique Visitors, Entrance Sources, and Exit Sources to gauge the pages impact and popularity. Finally, you can export the data to CSV or Google Sheets.
Semrush Traffic Analytics reports are based on petabytes of clickstream data that comes from multiple proprietary and 3rd party data sources, Semrush’s proprietary AI and machine learning algorithms and Big Data technologies. The data is accumulated and approximated from the user behavior of over 200 million real internet users and over a hundred different apps and browser extensions. Traffic Analytics data is not obtained from any website’s internal analytics. If you want to analyze top pages of your own website, we recommend that you refer to your own Google Analytics.