The Organic Positions report allows you to see all of the keywords that a domain has pages ranking for in Google's top 100 results. For every keyword a domain ranks for, you can see the corresponding landing page and a handful of metrics about the nature of that keyword. Running this report on a competitor's domain is a great first step in gathering competitive intelligence.

Top of Report
At the top, you’ll see three numbers: the website’s total number of keywords with organic positions (in Google’s first 100 results), the expected monthly traffic from those keywords, and the estimated monthly cost to rank for those keywords in Google Ads.
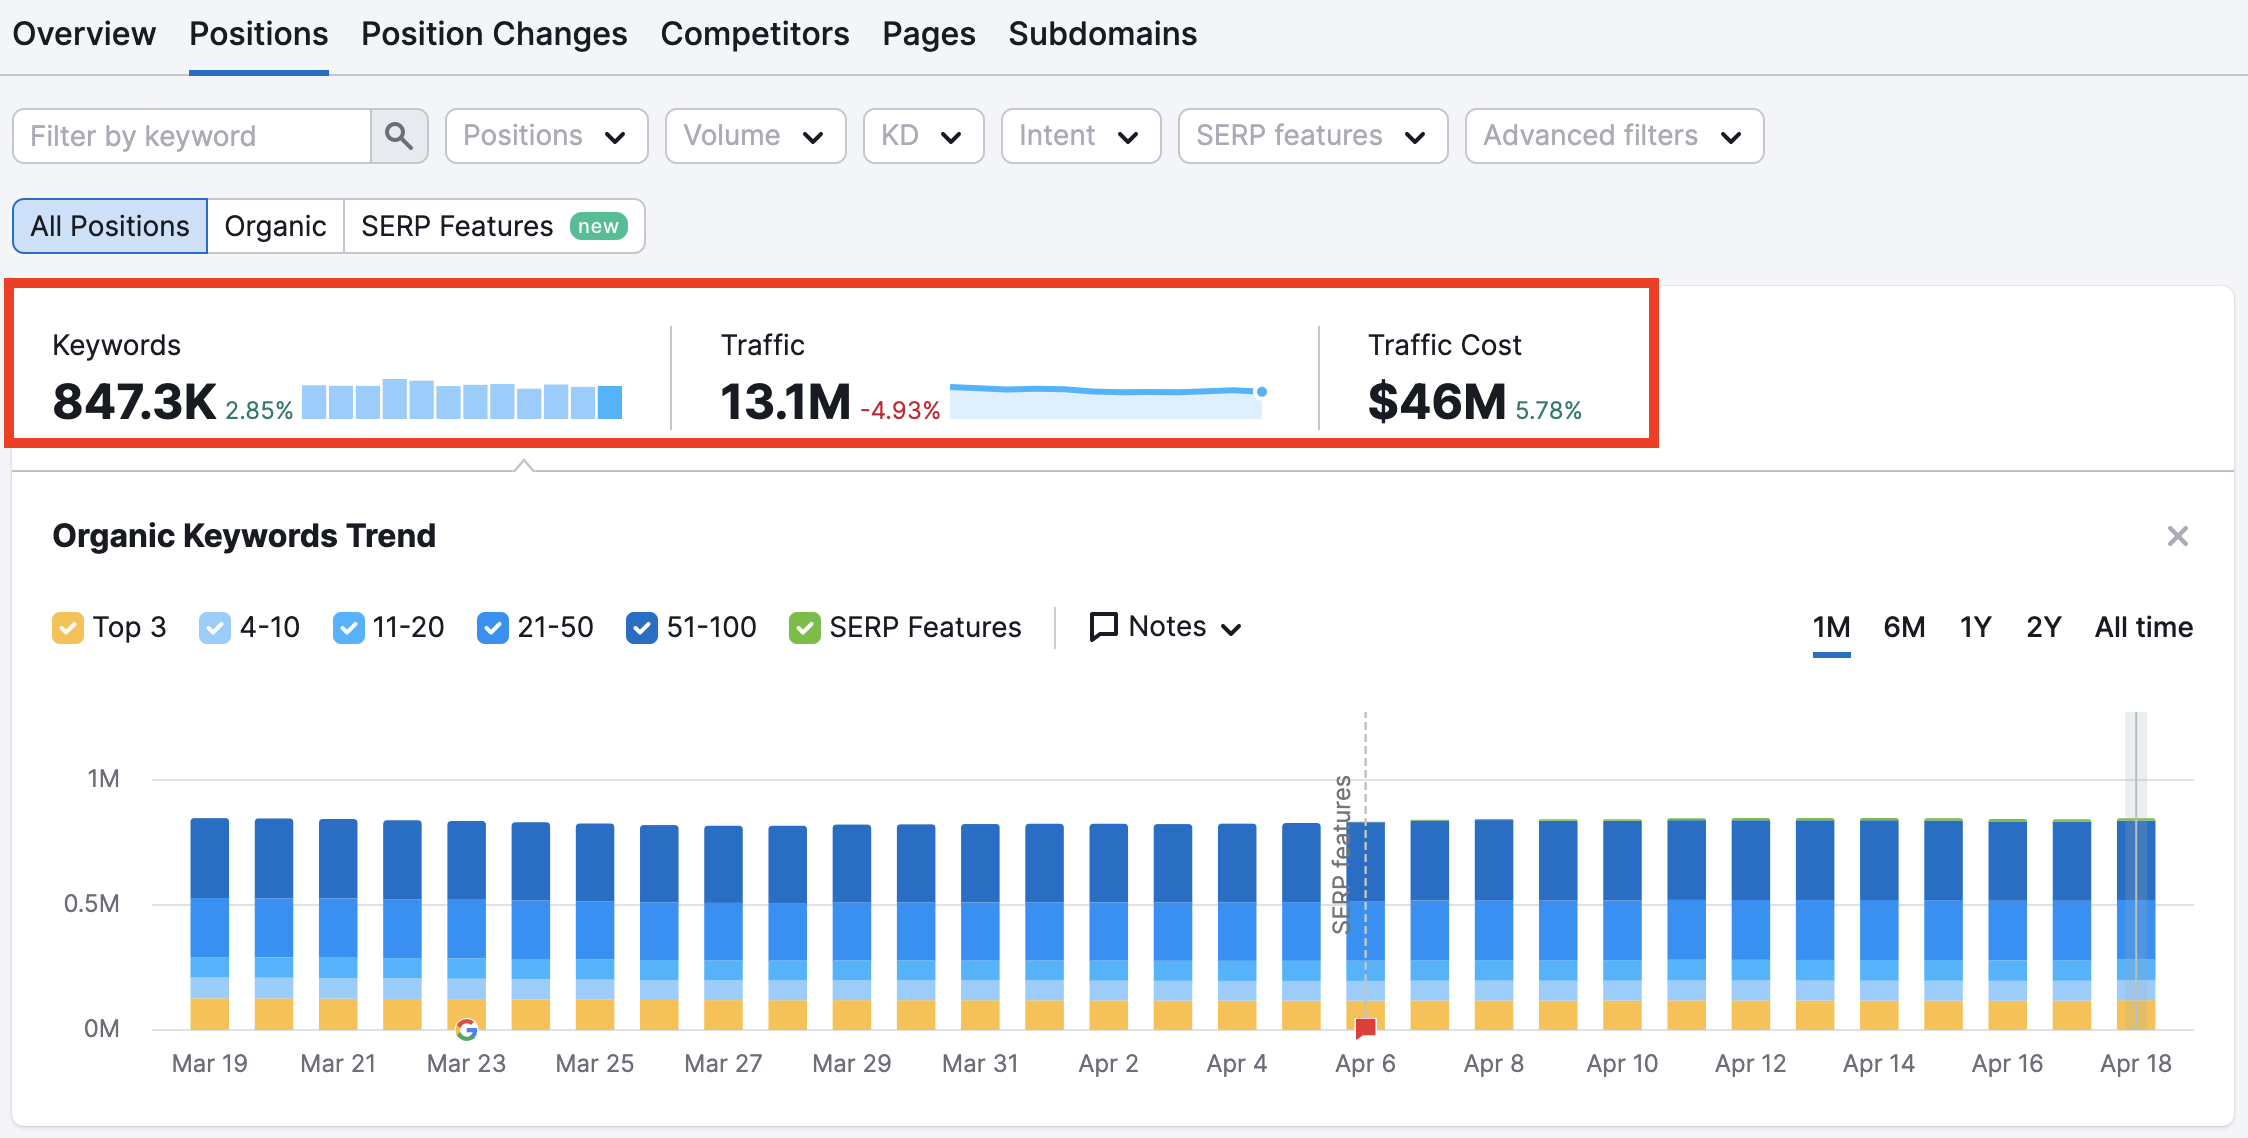
These numbers give you a quick snapshot of a website’s overall scope of organic search visibility. As you can see above, Semrush found 847.3 thousand keywords where the domain had a page ranking in the top 100 results on Google (in your chosen database).
From these 847.3 thousand keywords, Semrush estimates that the domain receives an average of 13.1 million monthly site visits.
The third number, $46 million, tells us that if you wanted to bid on the 847.3 thousand keywords the domain ranks for, you would have to spend an average of $46 million per month on Google Ads.
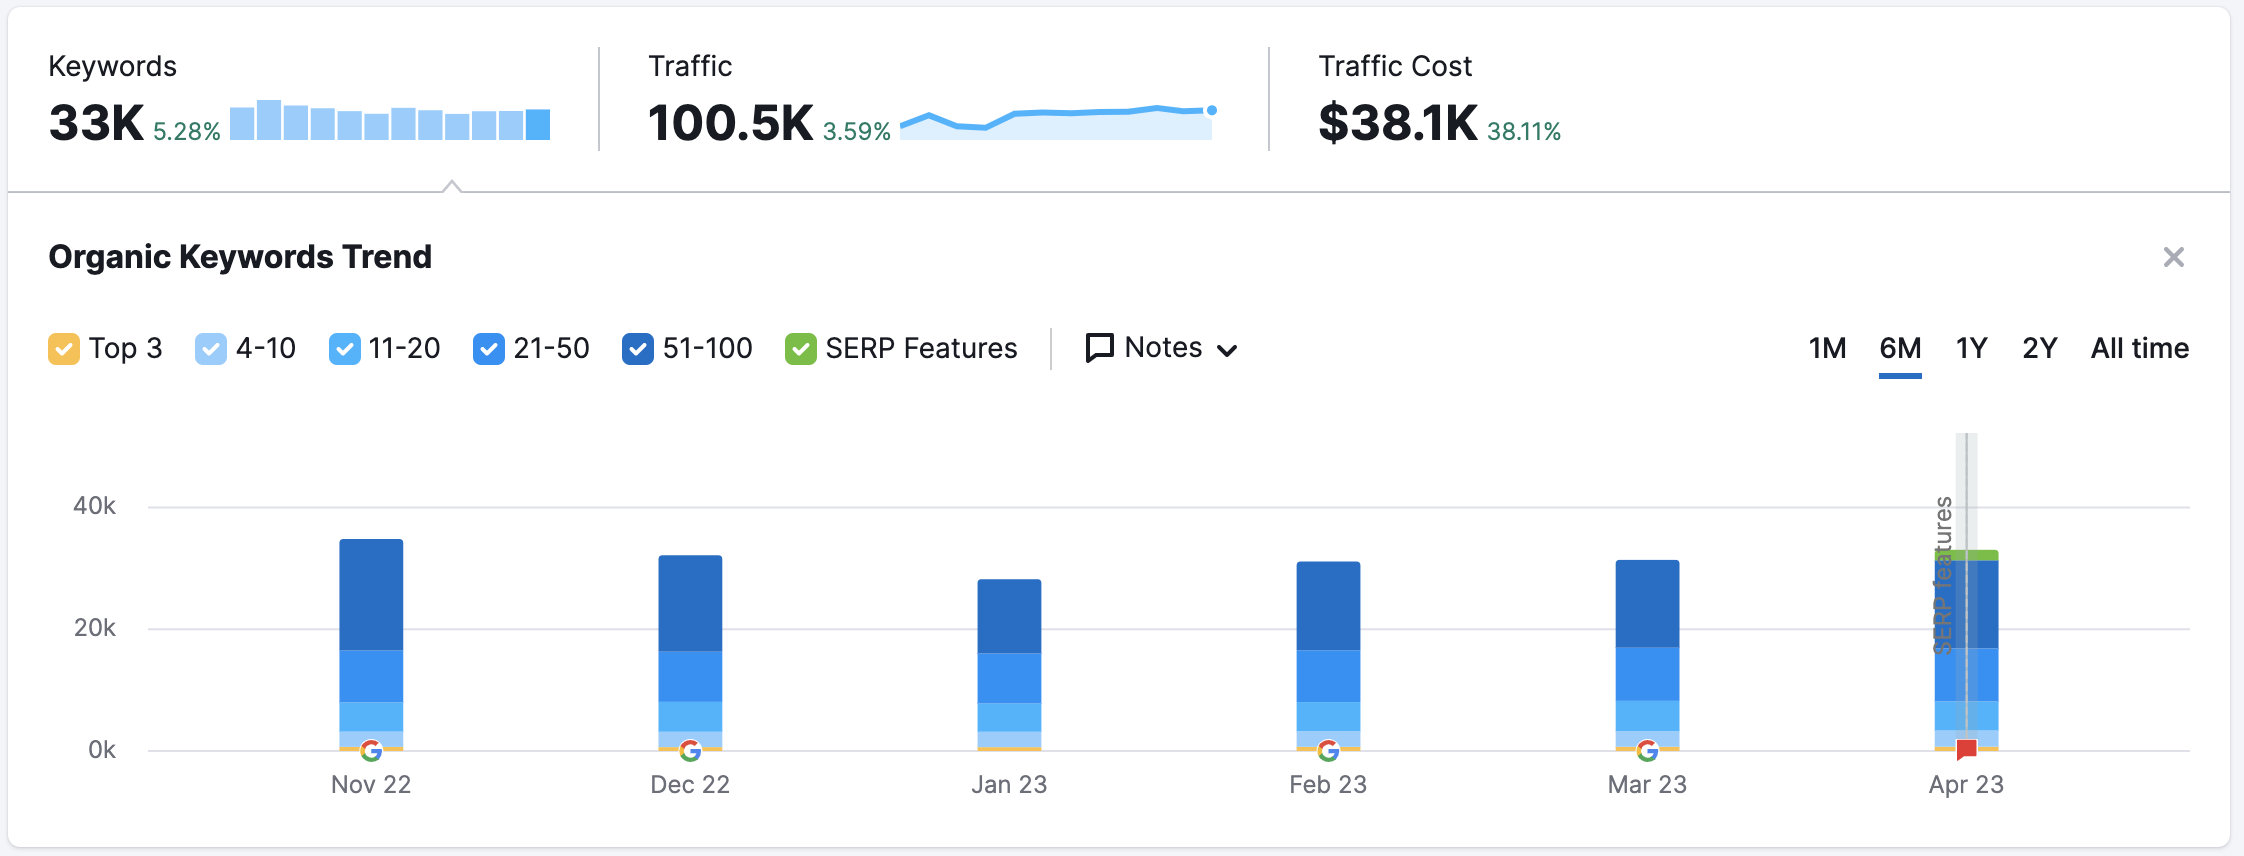
To compare with another example (below), we can see that the domain ranks for about 610.8 thousand keywords, which we estimate could bring around 546.8 thousand monthly site visits from search. Getting those site visits from paid search ads would cost roughly $14.6 million per month on Google Ads.

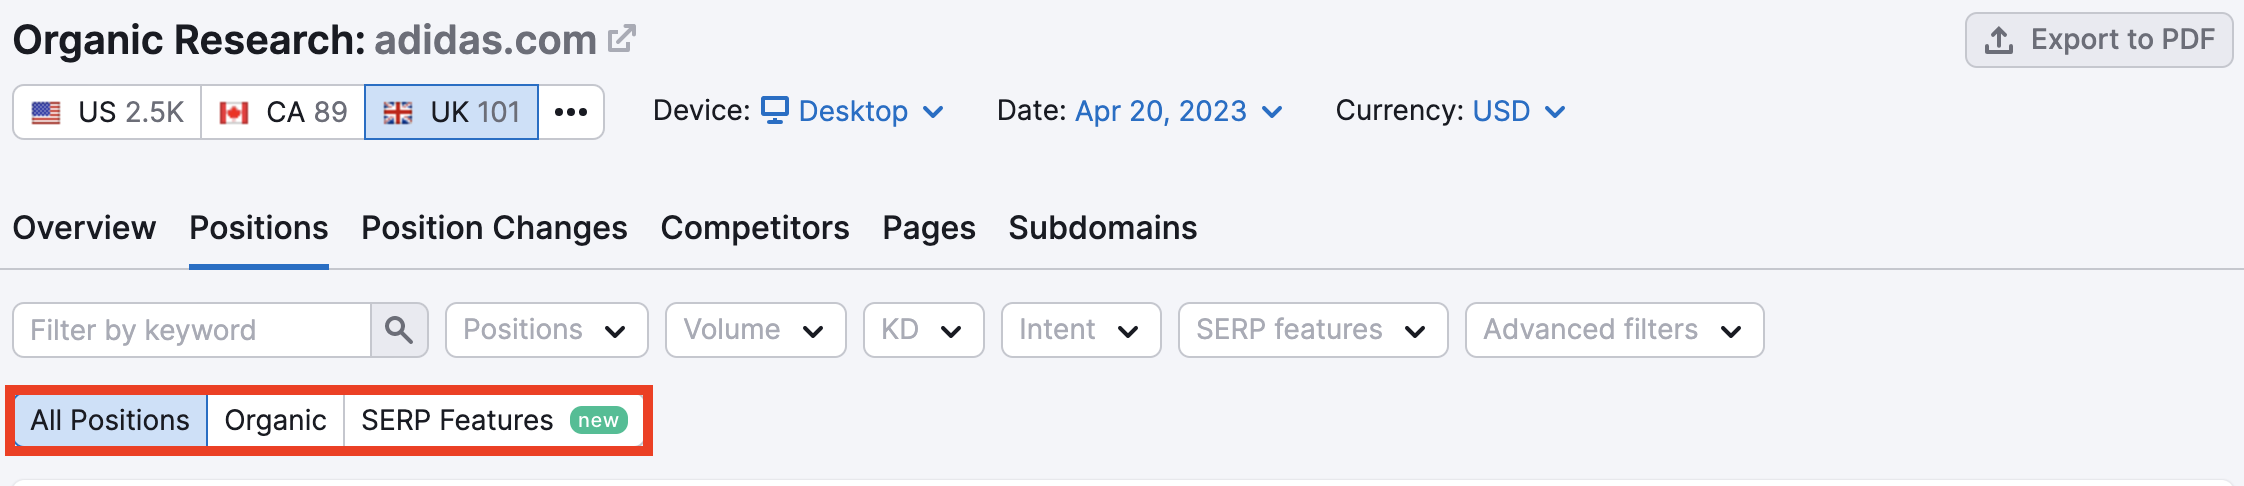
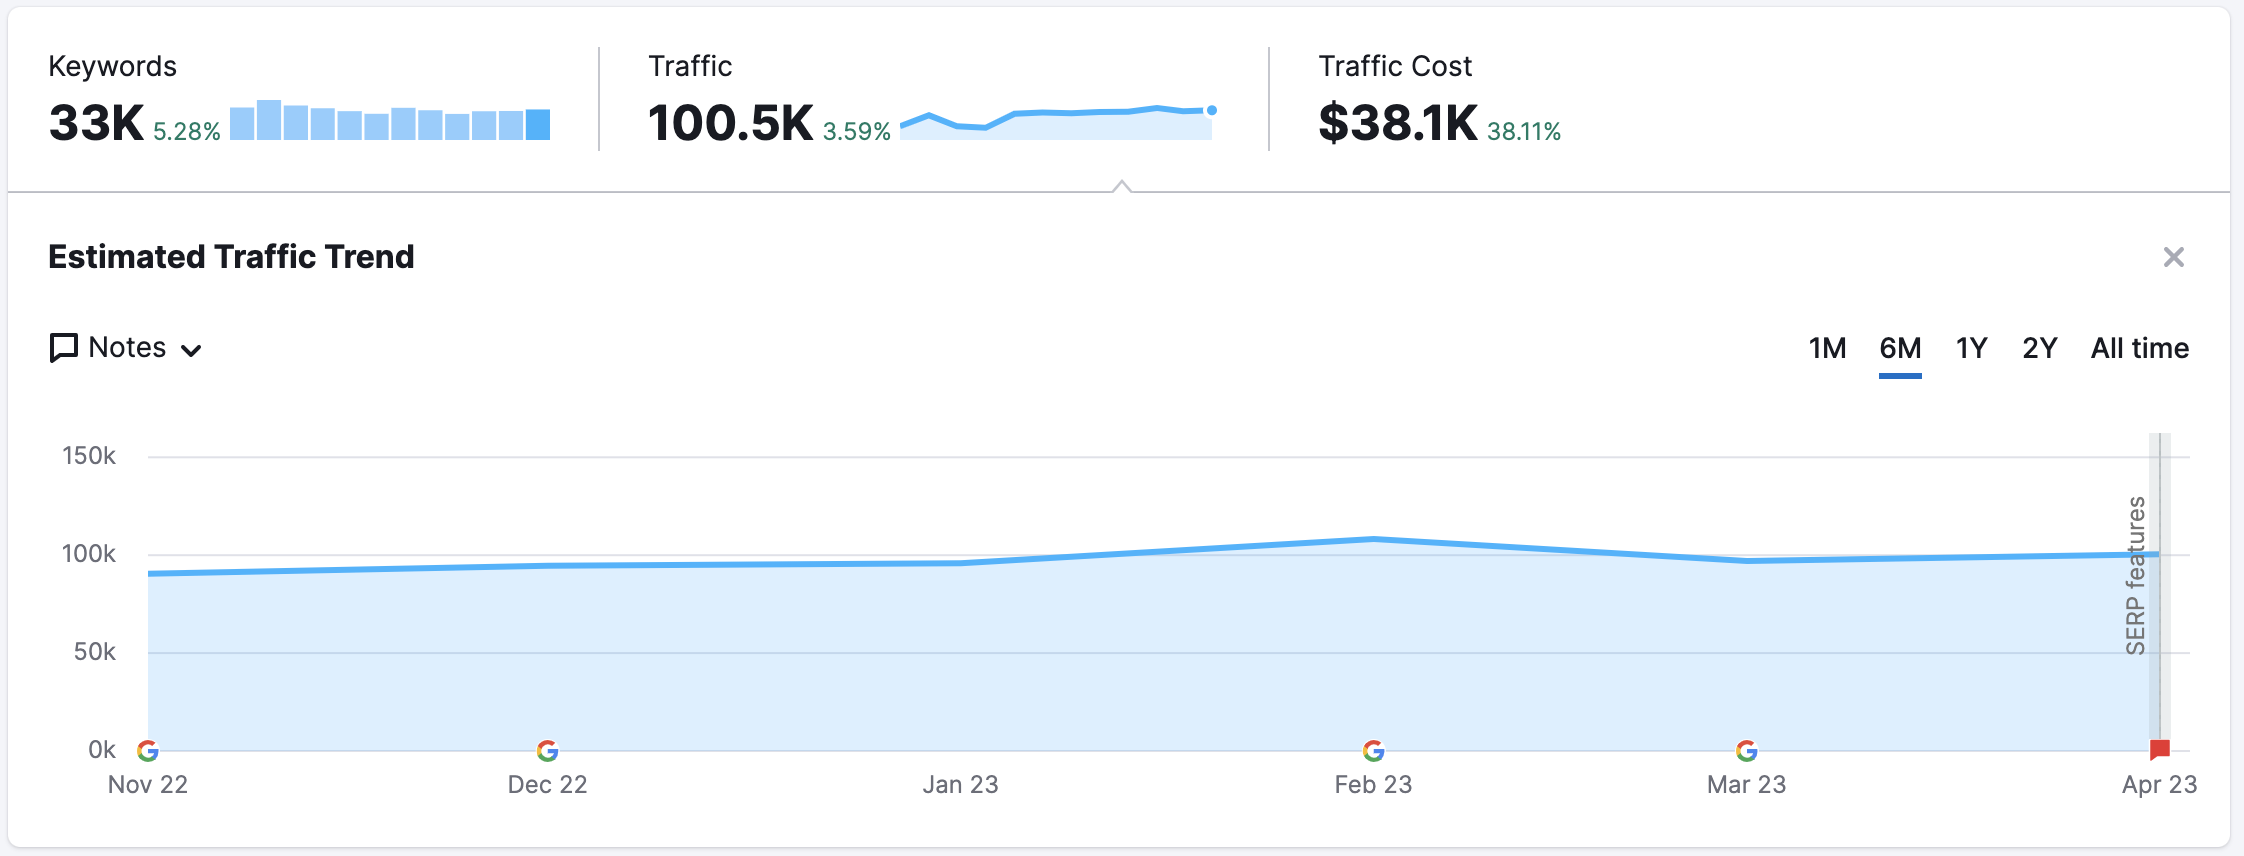
With the filter at the top of the report, you can see a domain's estimated traffic coming from all positions, organic or SERP features.
Traffic and Keywords Graph
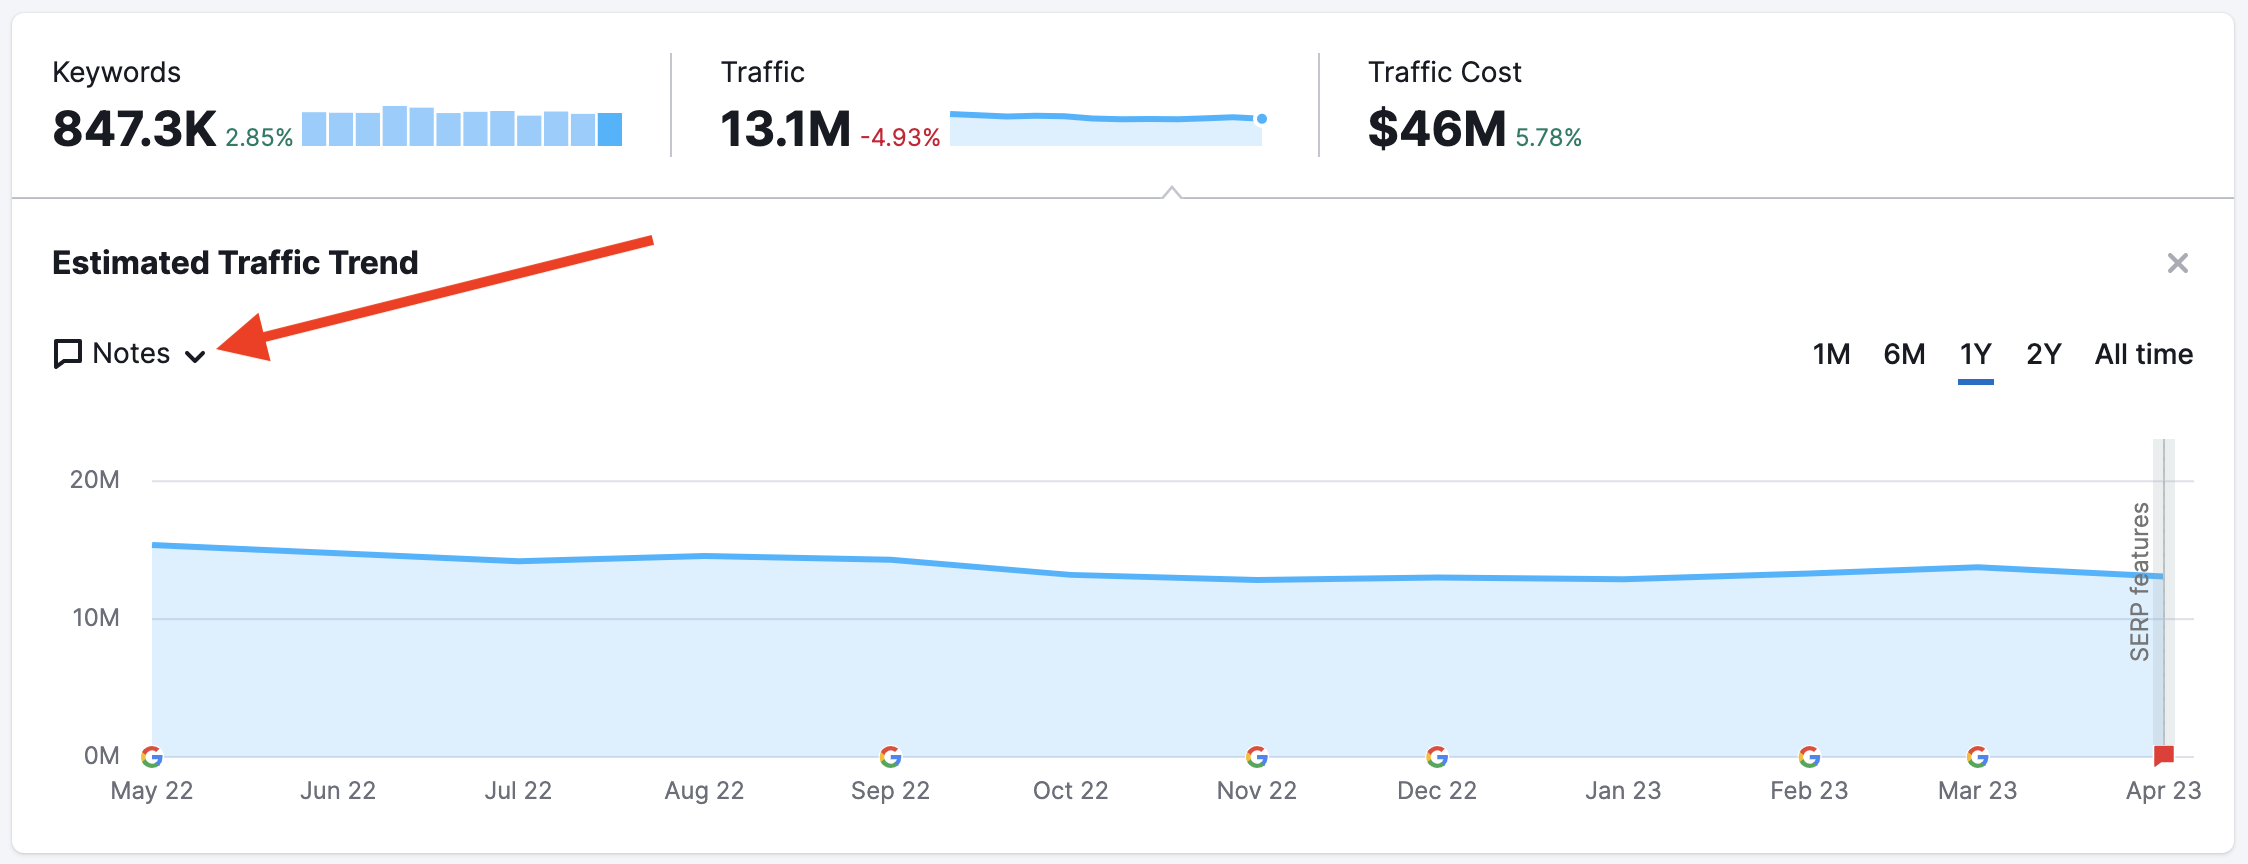
Next is a graph measuring the domain’s change in organic search traffic and keywords over time. Estimated traffic indicates the number of estimated site visits based on the domain’s organic search positions, and the keywords indicate how many organic keywords the domain has positions for.
Change the focus between measuring keywords or traffic, and change the time range from 1 month all the way to all-time with the controls above the graph.
Notes
Also featured in this graph are your Notes. Notes are Google icons and red note icons at the bottom. The Google icons are added by Semrush, indicating days when we noticed Google implemented changes to its algorithm or Semrush updated its database. We add these notes because a change to Google’s algorithm could influence a website’s rankings, and an update to the Semrush database could increase the number of keywords we found a website ranking for. Click on a note to read the details.
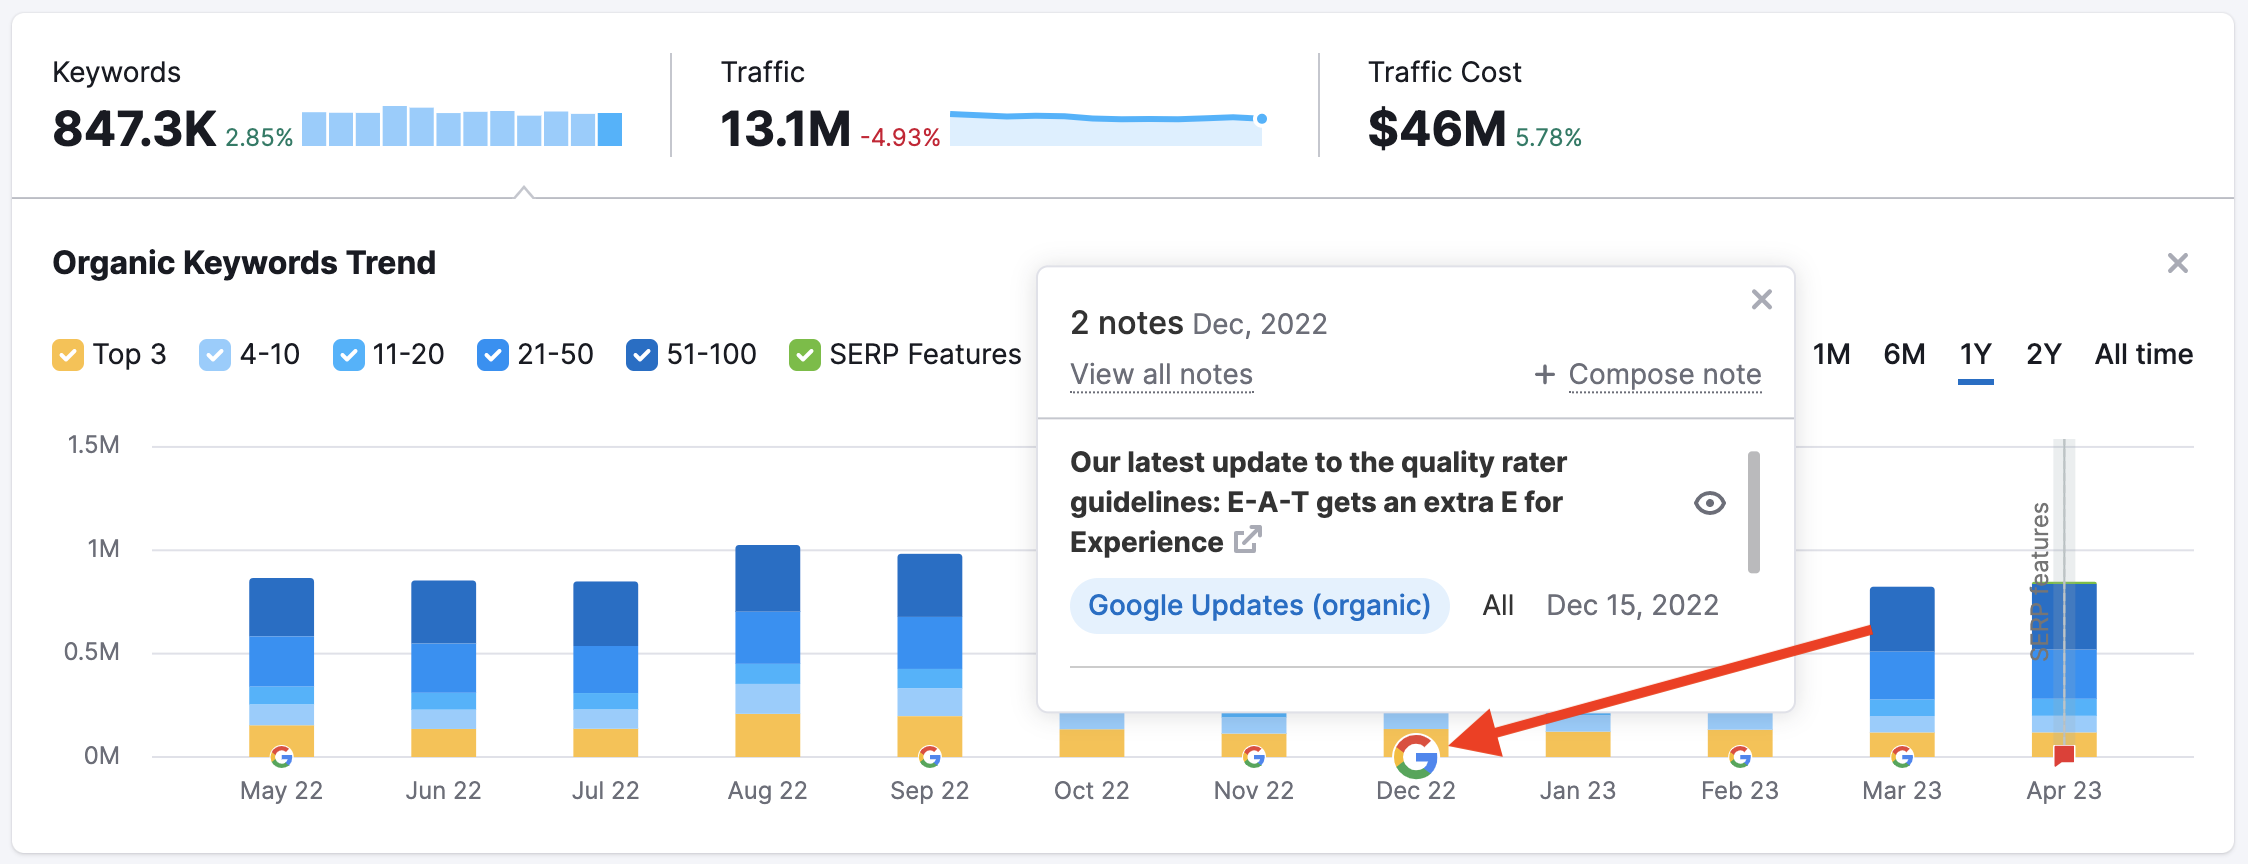
You can also add your own custom notes to keep track of days when you launched a campaign, performed site maintenance, or any other significant dates. Custom notes are displayed as the red notes icon. To control the types of notes shown, click on Notes above the graph and check the boxes you want to see.
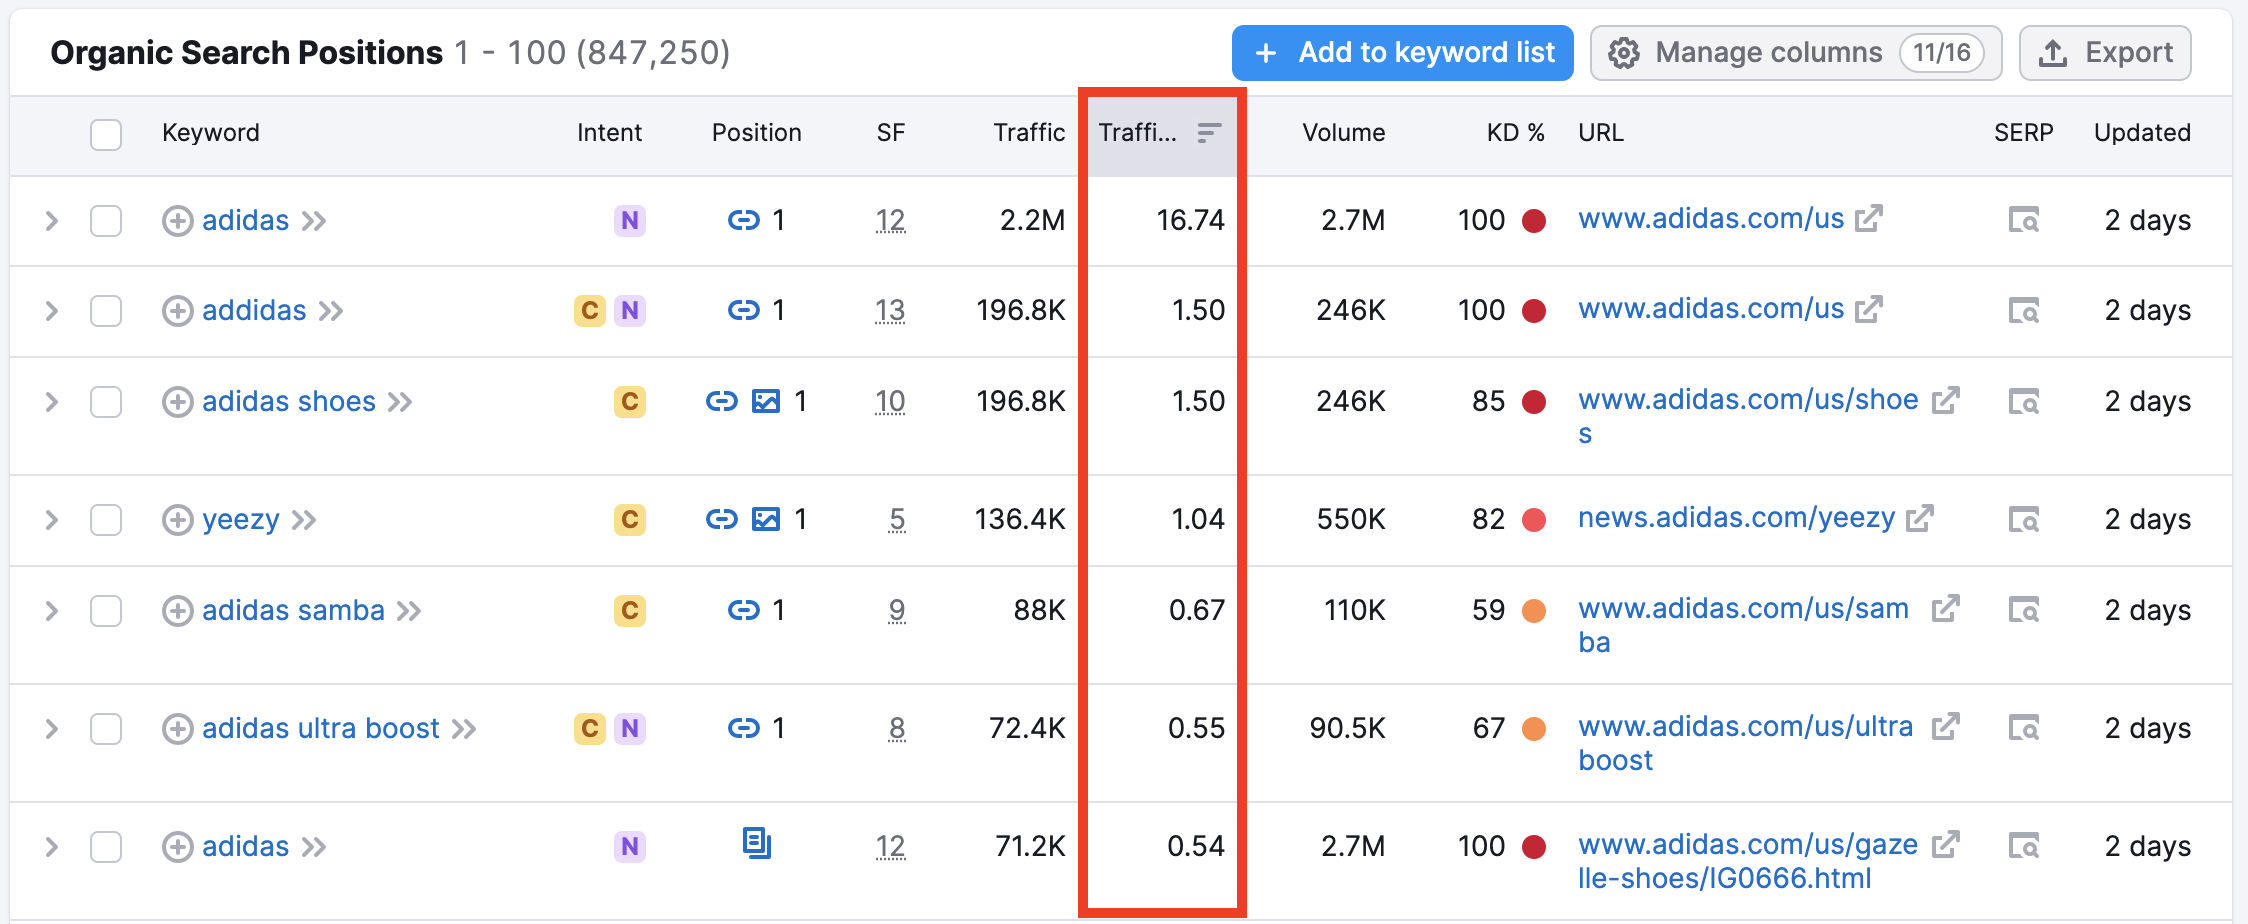
Organic Search Positions Table
Scroll down to the main section of this report. For each keyword in the table, you can choose to see:
- Keyword
- Intent
- Position
- SERP Features
- Difference
- Prev. position
- Traffic %
- Traffic
- Volume
- KD % (Keyword Difficulty %)
- CPC (USD)
- URL
- SERP (click to see a snapshot of the actual results page)
- Costs
- Competitive Density
- Results
- Last Update
The report automatically sorts keywords by traffic, so the higher up on this list, the more organic traffic the keyword brings to the website. However, you can quickly sort by any other metrics by clicking the arrows next to each column title.
You can choose to hide or display your columns under the manage columns button at the top right of the table.
The SERP column allows you to view the SERP source or the actual snapshot of where Semrush gathered this data. Click on the icon, and a new tab will open, taking you to the search engine results page, where you can see the site’s landing page listed (it will be highlighted) within the rest of the results.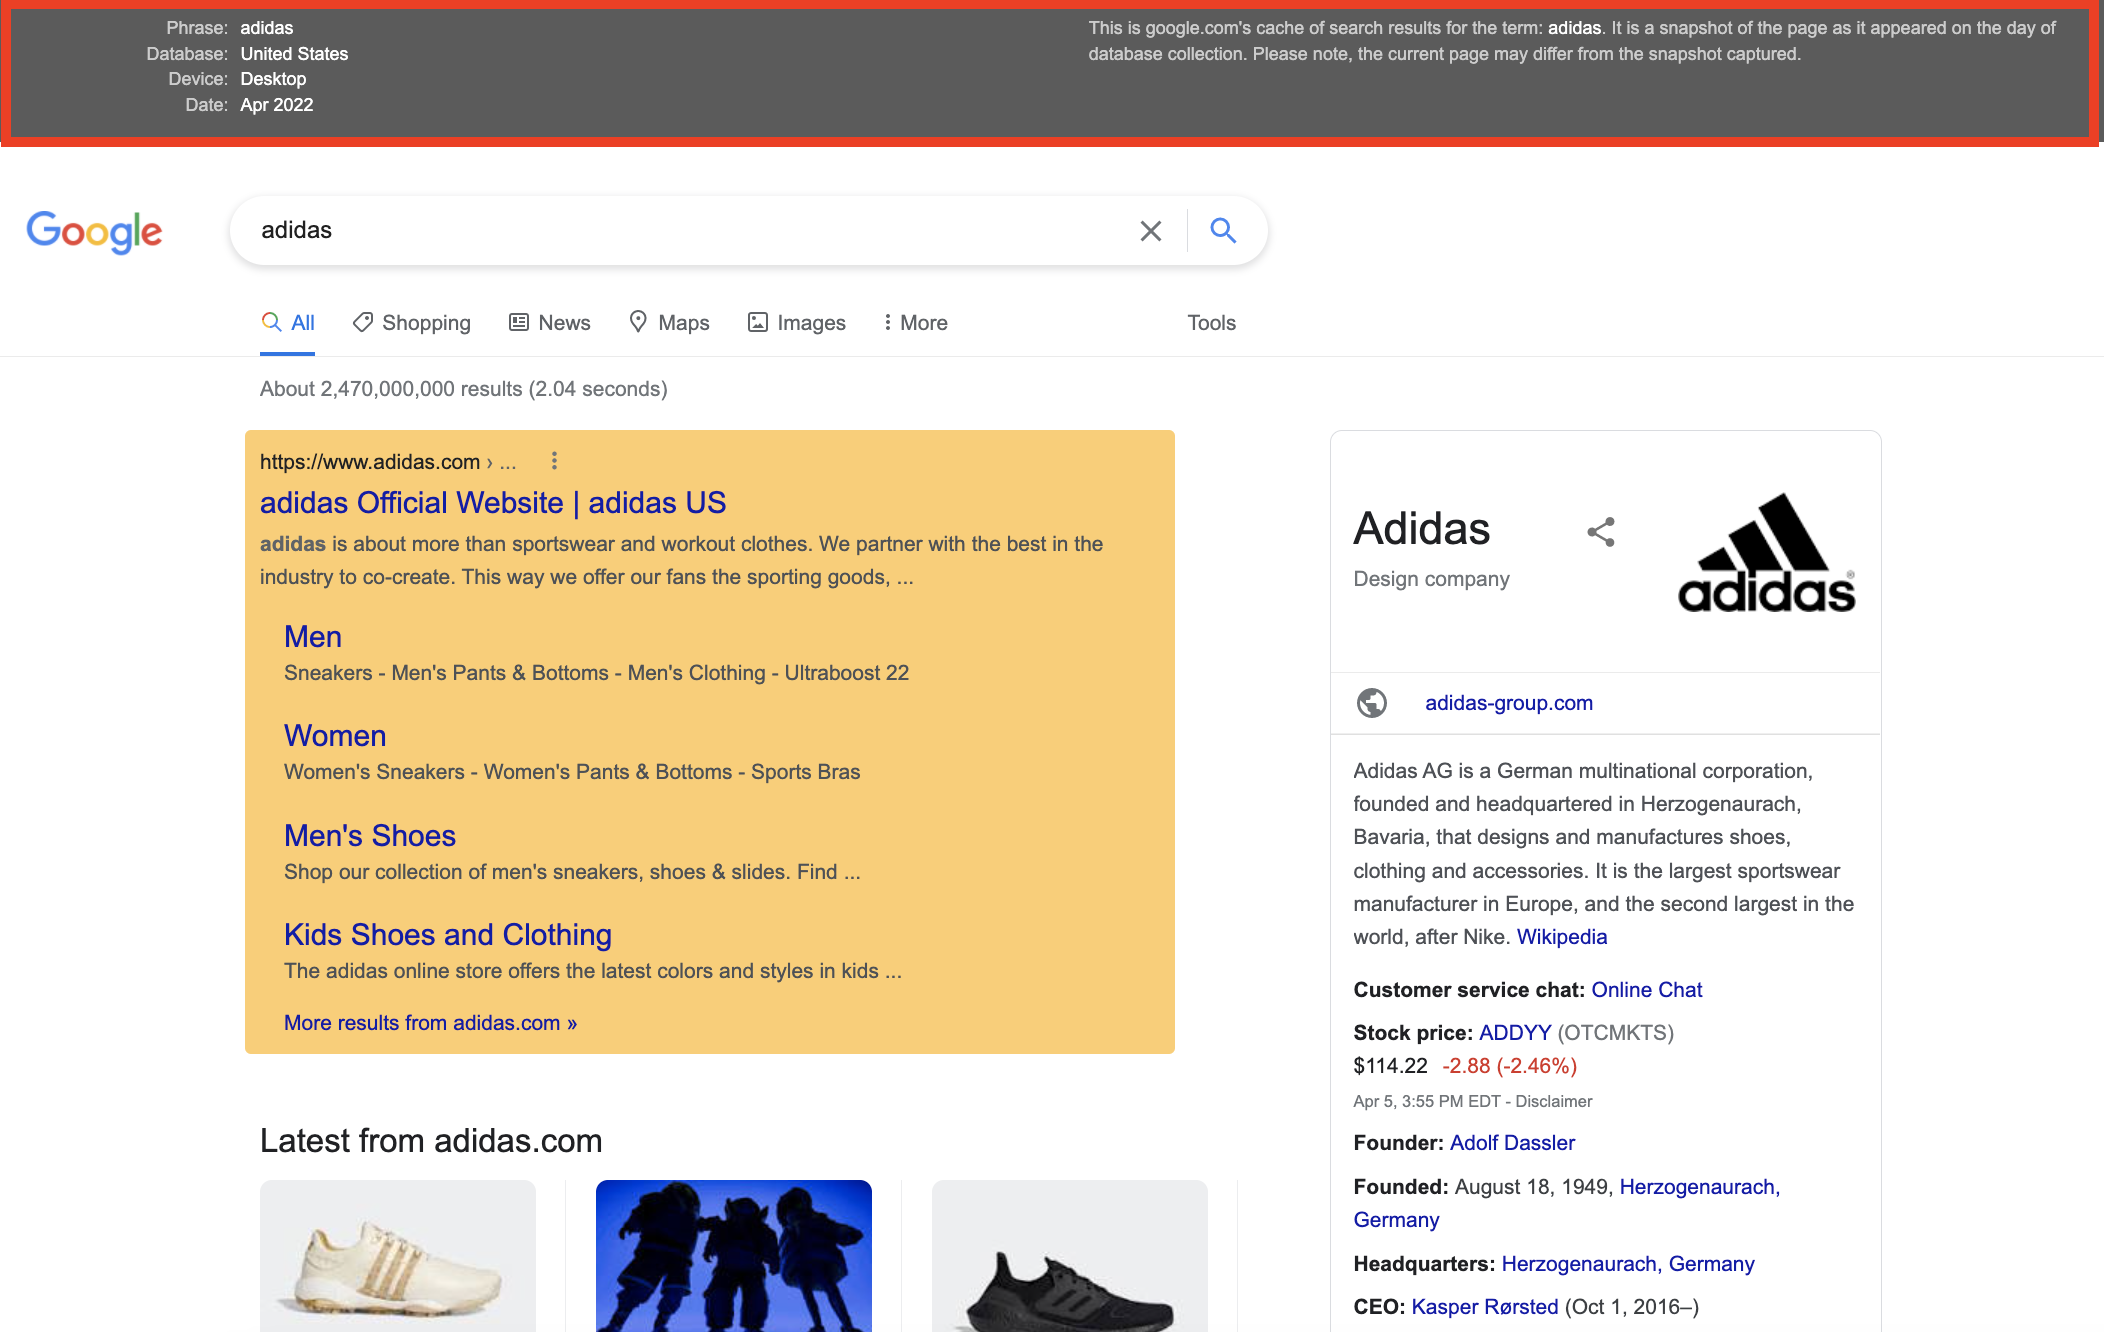
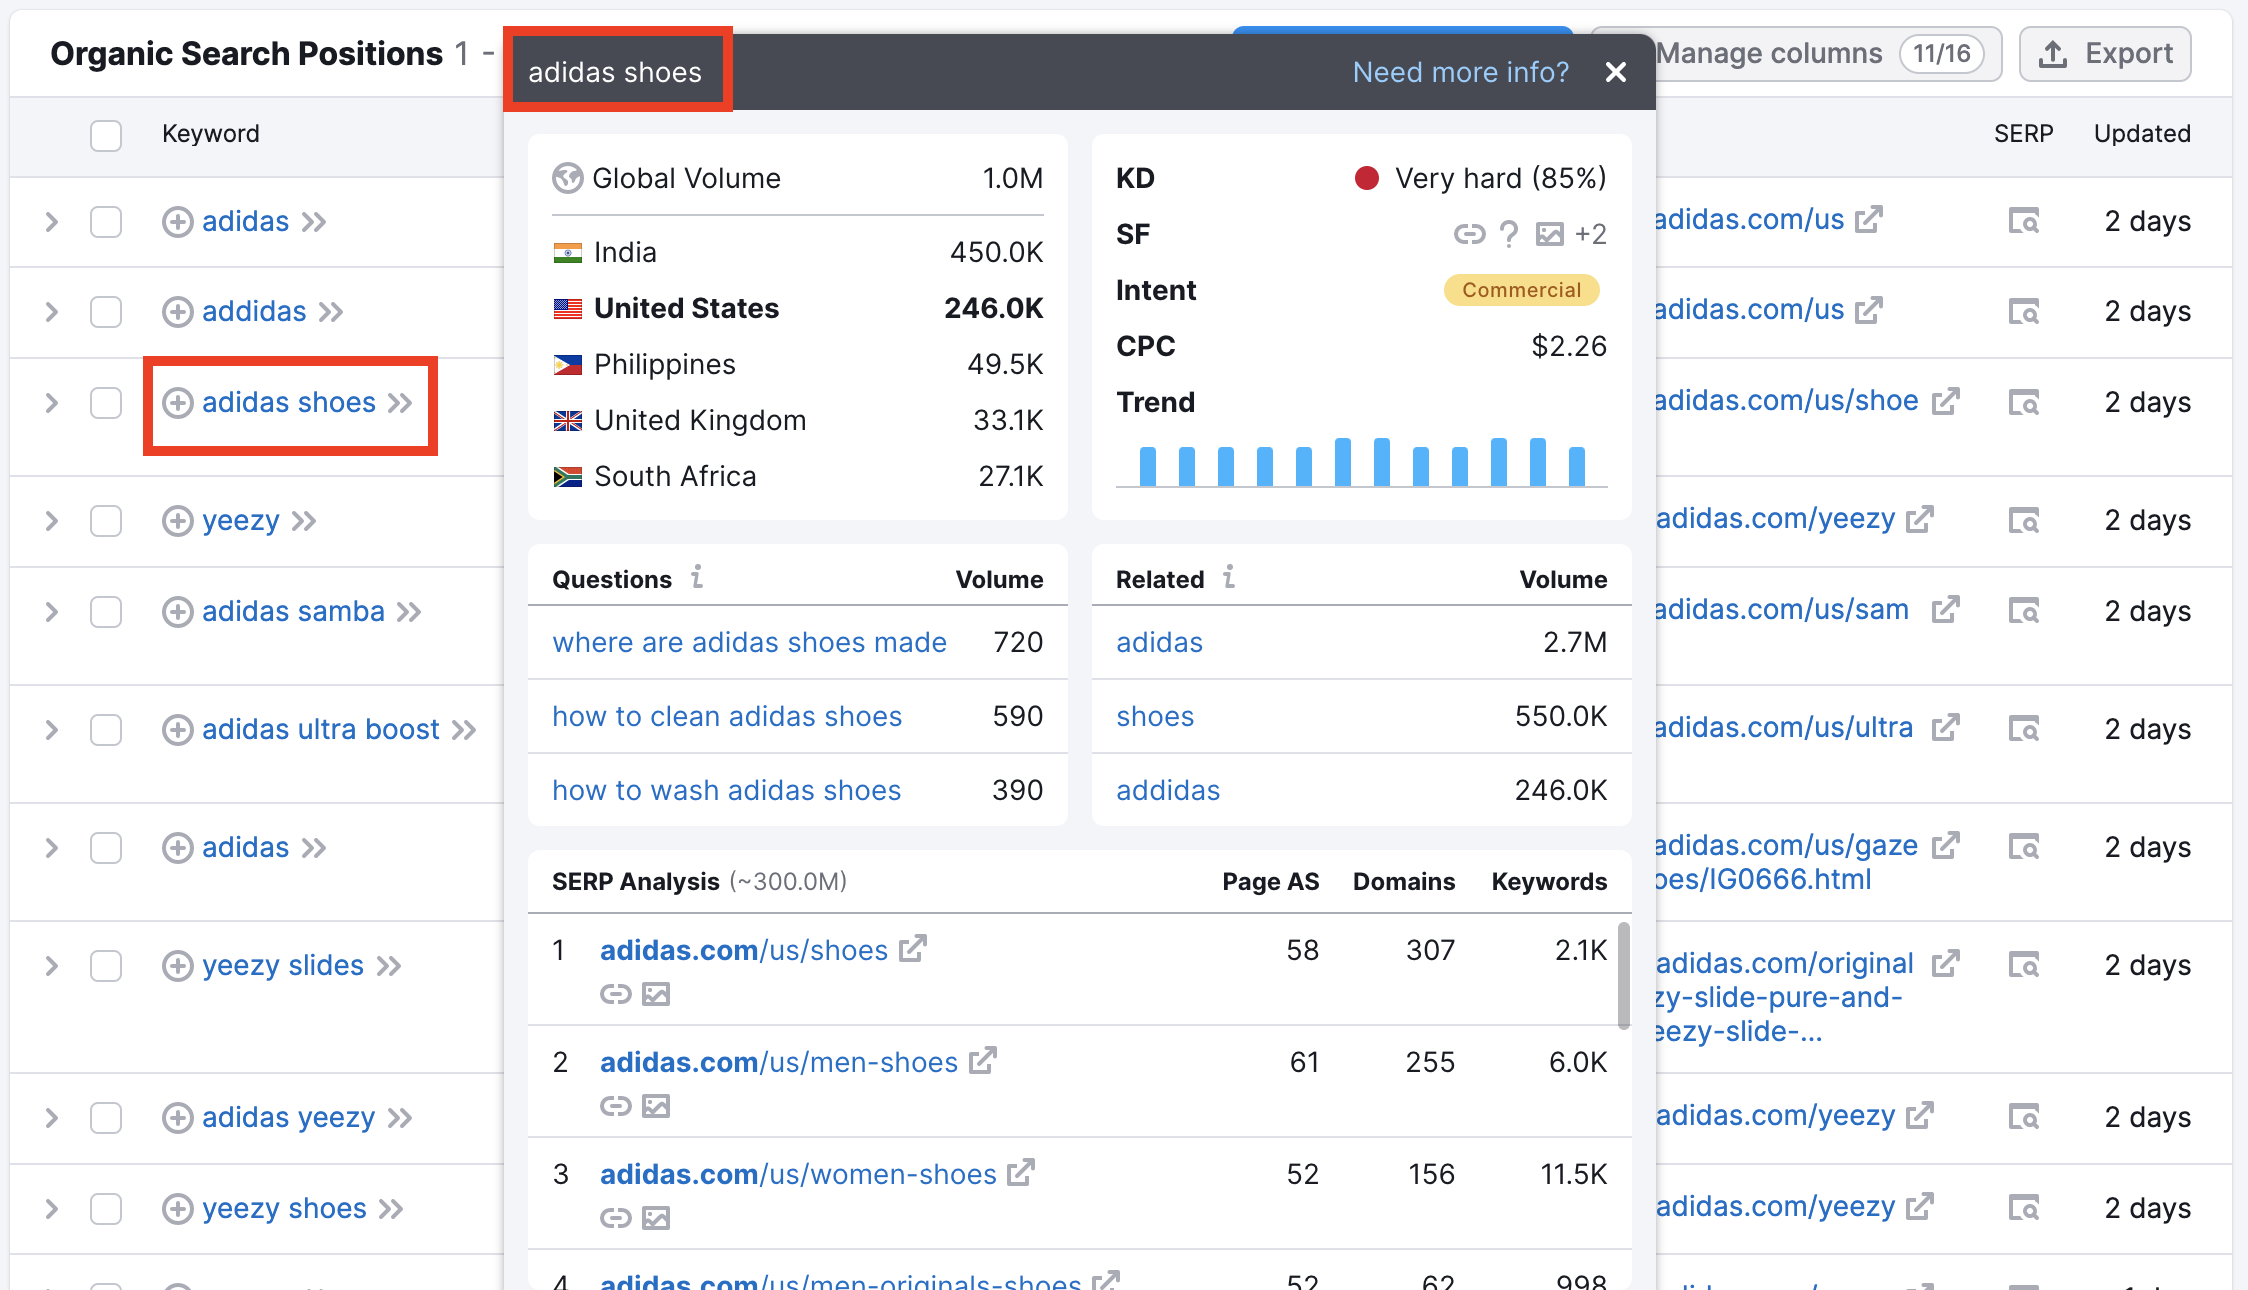
If you click on the keyword row, you will see the keyword, URL, and SERP Features associated with the keyword. You can also see a snapshot graph showing the positions of pages that have ranked for the keyword over your designated period. If you click on an arrow near the keyword, you will see the Keyword Overview snapshot with the key stats for the specific keyword.
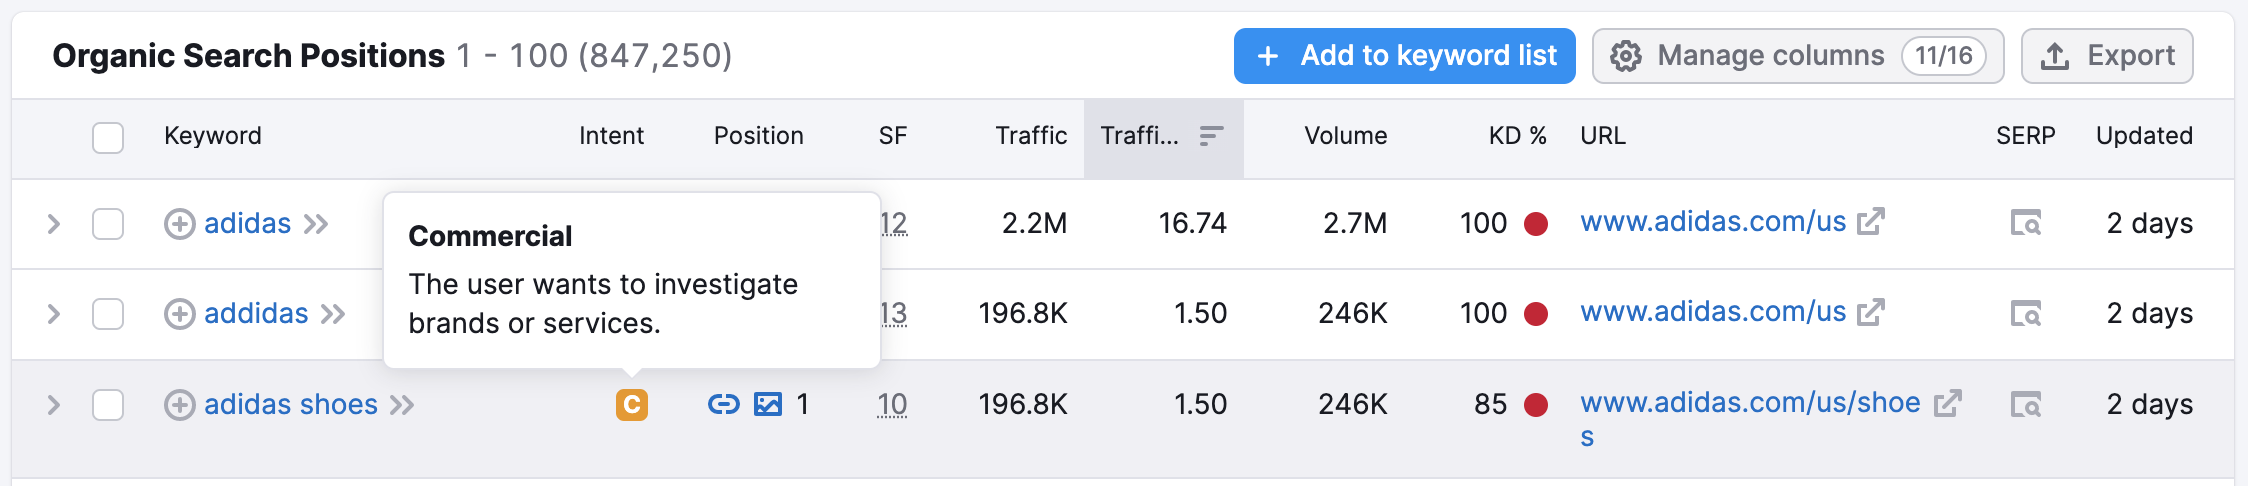
The Intent column lets you automatically discover your audience’s search intent for each keyword. Hover over the intent mark to see the purpose of a user’s search. The 4 intents are transactional, commercial, informational, and navigational.
Adding Keywords to Keyword Manager
Keyword Manager is another keyword research tool on Semrush that allows you to collect keyword research from across Semrush’s tools, organize your research into lists, and then refresh the metrics on your list in real-time.
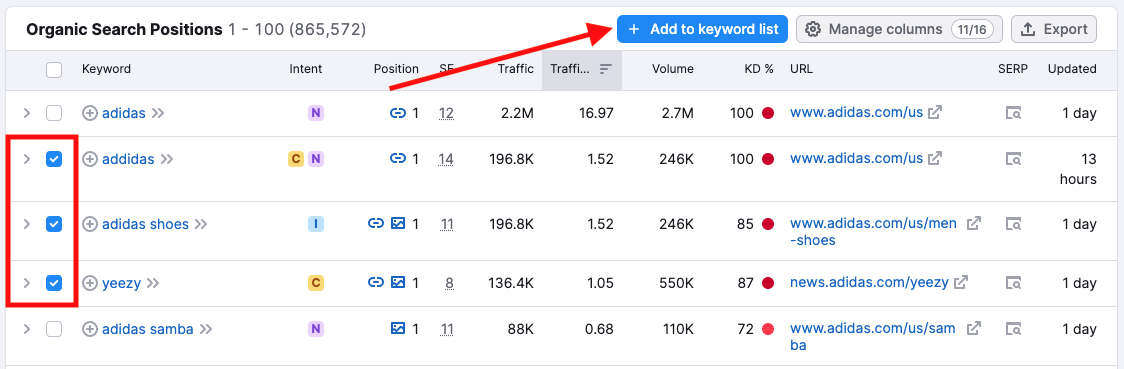
To add keywords from this report to Keyword Manager, just check them with the checkbox and choose to add them to an existing list or a new list.
Each list in Keyword Manager can contain up to 1,000 keywords. Once you have a list in Keyword Manager, you can also send your list of keywords to other Semrush tools such as Position Tracking, PPC Keyword Tool, or SEO Writing Assistant.
For more help on using Keyword Manager, read this article.
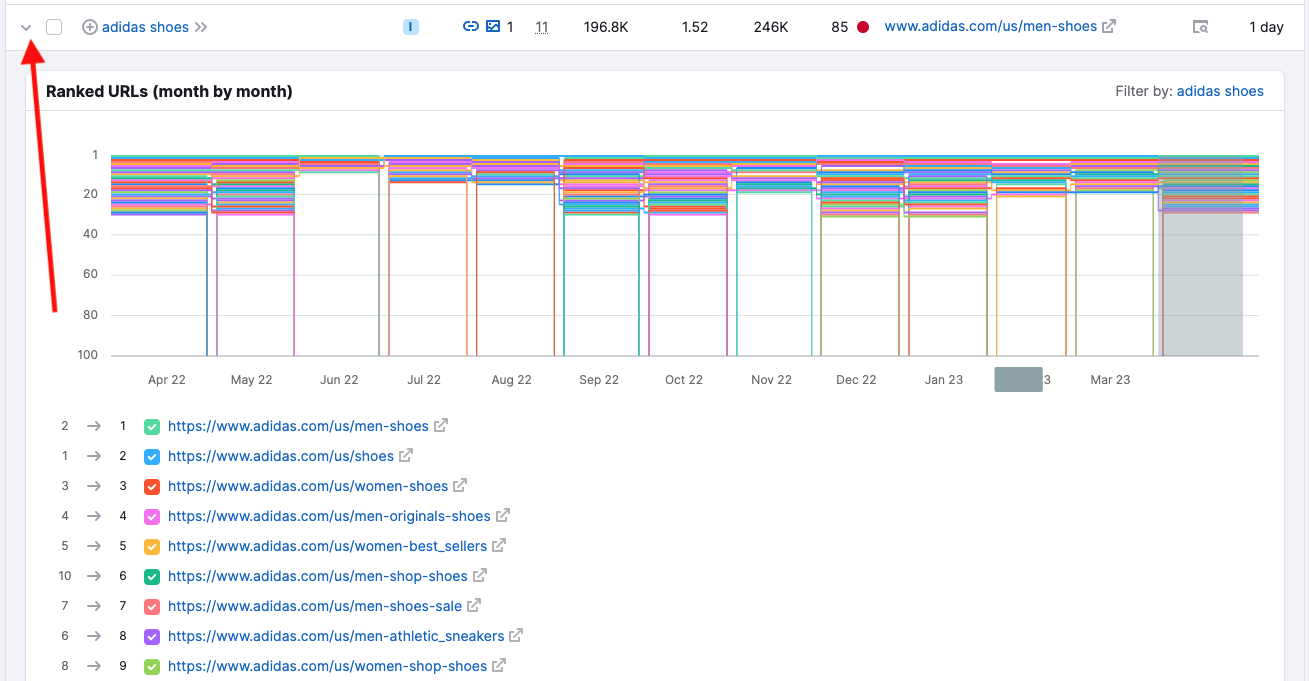
Ranking History For A Keyword
By clicking on the arrow next to a keyword in the Positions or Position Changes tab, you will find the ranking history of your competitor for a particular keyword. When opening the Ranked URLs (month by month) graph, you will see the month-by-month overview of the URLs that ranked in the top 100 for a specific keyword for the last 12 months.
You can also see any domain’s history for a particular keyword for all time if you can access the historical data (available on Guru and Business levels). To see it, change the Date on top of the Positions report.
Filters
You can filter down your search by keyword. Simply enter the keyword you want to research in the filter search bar at the top of the graph. However, if you want an even more specific search, you can use the advanced filters dropdown directly to the right.
These advanced filters include keyword, keyword type, volume, CPC, KD, URL, Traffic, Costs, Com., Results, SERP Features, word count, and last update.
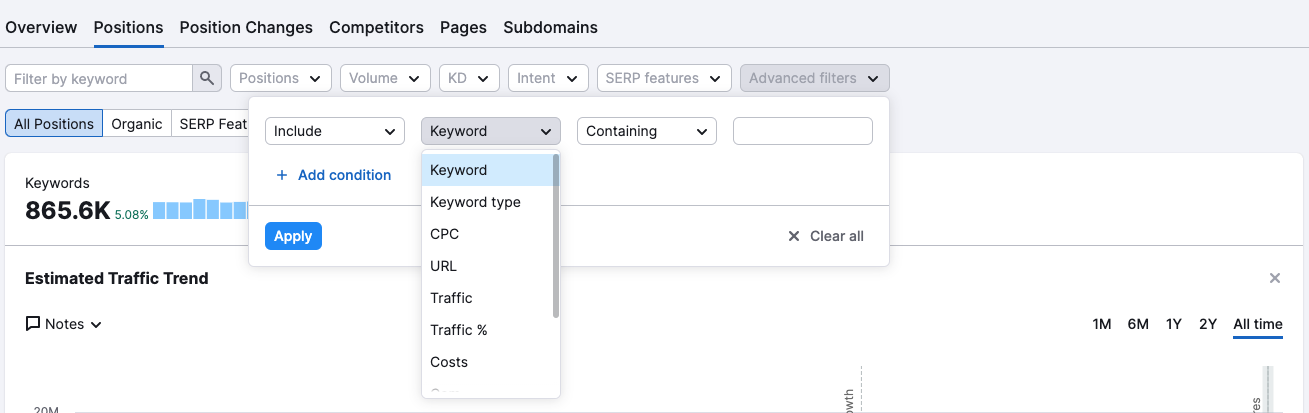
Add multiple simultaneous filters to narrow the focus of your data down as specific as you need. Using multiple filters is a great way to build a list of long-tail, topic-specific, or low-cost keywords to target your site. Currently, there is no limit to the number of filters you can run on this report.
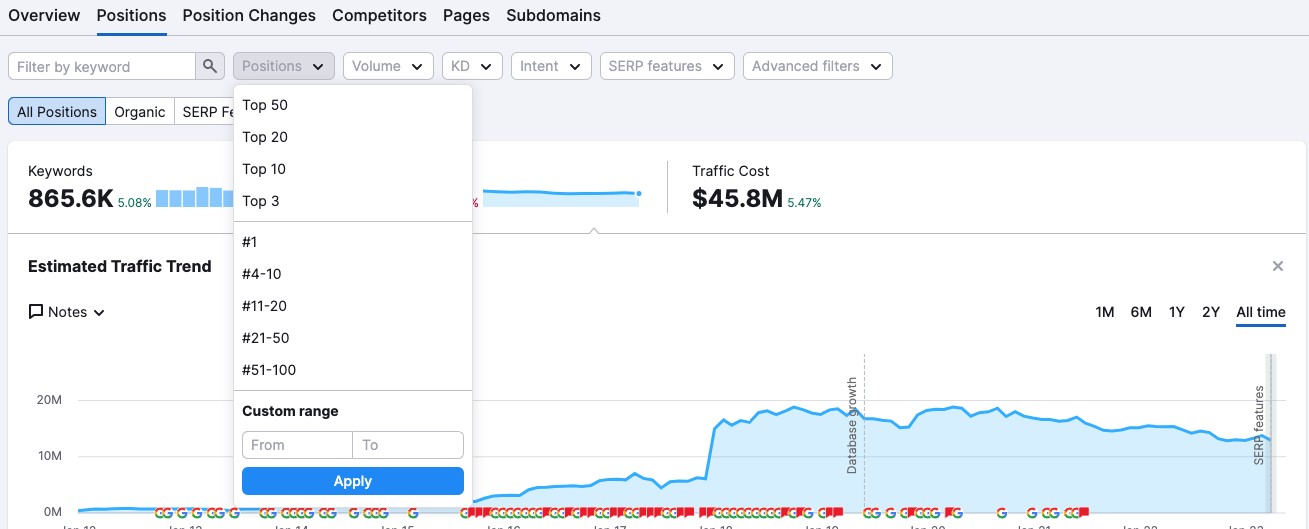
Positions
You can filter your report by the position of the keyword. This can be done using the positions dropdown filter. This lets you filter the report by the top 50, top 20, top 10, and top 3 keywords, as well as for positions #1, #4-10, #11-20, #21-50, and #51-100.
You can create any custom range if you are looking for keywords in a specific position differing from the preset filters.
Intent
You can supplement your competitive research with intent analysis by using the intent filter. It makes grouping and analyzing keywords by a specific intent type easier.
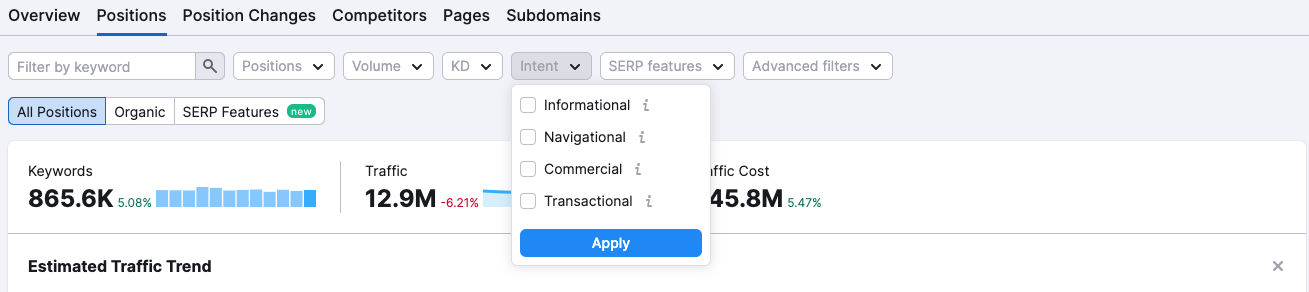
Check or uncheck the intent boxes to filter out the list of keywords.
This filter can help you understand what the users are searching for and analyze if they land on the right page.
SERP Features
The SERP features column lets you analyze the presence of special results among the keywords in this report.
These features can be filtered out using the advanced filter option so that you can look for keywords that are ranking for a specific SERP Feature. If you filter by SERP Feature found in Featured Snippets, we will show you just the keywords found in the Featured Snippet SERP.
There’s also a handy secondary filter to see further the relationship between the analyzed domain and the chosen SERP feature:
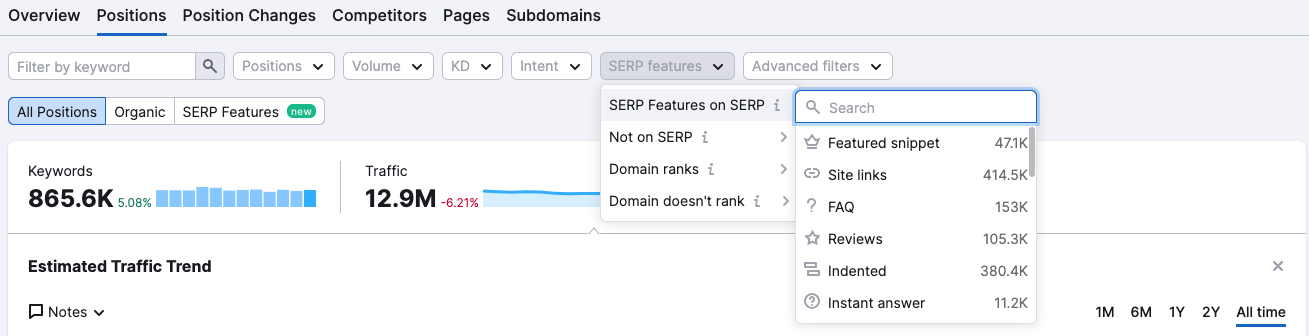
On SERP—to show keywords where analyzed domain ranks and a chosen SERP feature is also present on the SERP
Not on SERP—to show keywords where analyzed domain ranks and chosen SERP feature isn't present on SERP
Domain ranks—to show only the keywords where the analyzed domain has its content featured in the chosen SERP feature
Domain doesn't rank—to show keywords where the analyzed domain ranks in the results, the chosen SERP feature is present on the SERP, but the domain is not a part of that SERP feature.
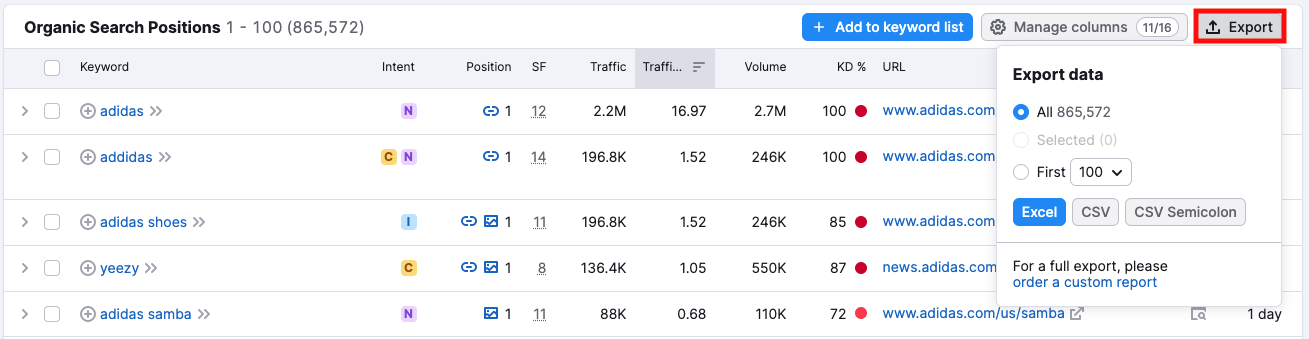
Exports
Users can export rows to an Excel, CSV, or CSV Semicolon file using the Export function. Select specific rows to export with the checkboxes to the left of the keywords, or choose to export the first 100, 500, 1,000, 3,000, 10,000, or 30,000 with the “Export” drop-down.
Depending on the level of your account, the number of rows you can view in a report will be limited as follows:
- PRO users can view 10,000 rows in a report
- GURU users can view 30,000 rows in a report
- BUSINESS users can view 50,000 rows in a report