The Review Analytics report is a competitive intelligence solution that lets you monitor your local competitors’ customer reviews on Google compared to your own. With it, you can:
- Benchmark the number of reviews you receive vs. the competition
- Compare average ratings
- Analyze the most relevant reviews for each business
- Quickly reference relevant business information like address, categories, and other attributes
You can find the Review Analytics report within the Listing Management tool.
Access & Limitations
The Review Analytics report is available for both Basic and Premium locations in the Listing Management tool.
Basic locations come with 1 Review Analytics report per month, and up to 5 competitors in the report.
Premium locations come with 5 Review Analytics reports per month, and up to 10 competitors in each report.
For more details about how to purchase and set up a Premium location, please refer to the Listing Management Knowledge Base article.
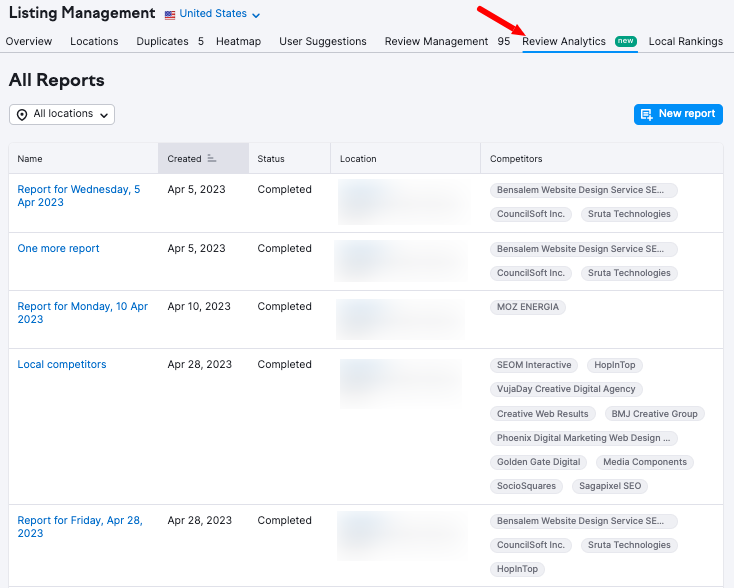
Where To Find Review Analytics
To access the Review Analytics report, first open the Listing Management tool. Then, in the tool, click on the seventh tab from the left.
How To Create A New Report
The first time you access Review Analytics, you’ll automatically be directed to the report creation form.
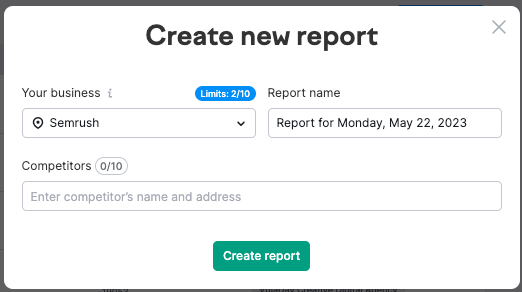
First, using the drop-down, select the business location you want to report on.
Second, if necessary, update the name of your report under “Report name.” The default name for every report is “Report for [Current Date].”
Finally, enter competitors whose reviews you want to analyze, and click “Create report.”
Once you create your report, you will automatically be directed to your new report. If it has not yet finished processing, you will see the following message:
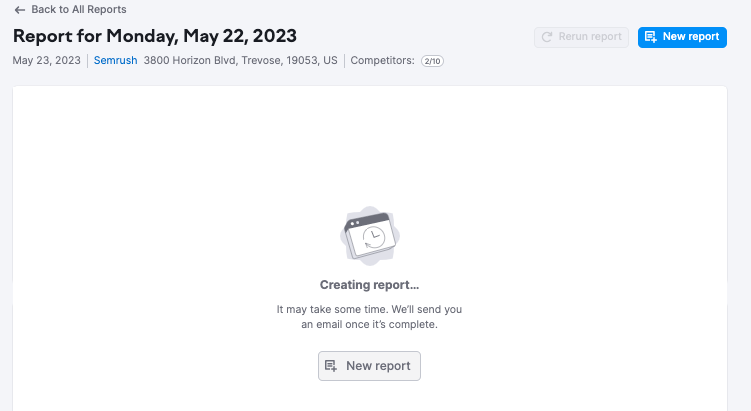
If you have a Premium location, you can create up to 5 reports per month. To create a new report, click the “New report” button to create an additional report. Or click “Back to All Reports” at the top of the page to return to your All Reports dashboard.
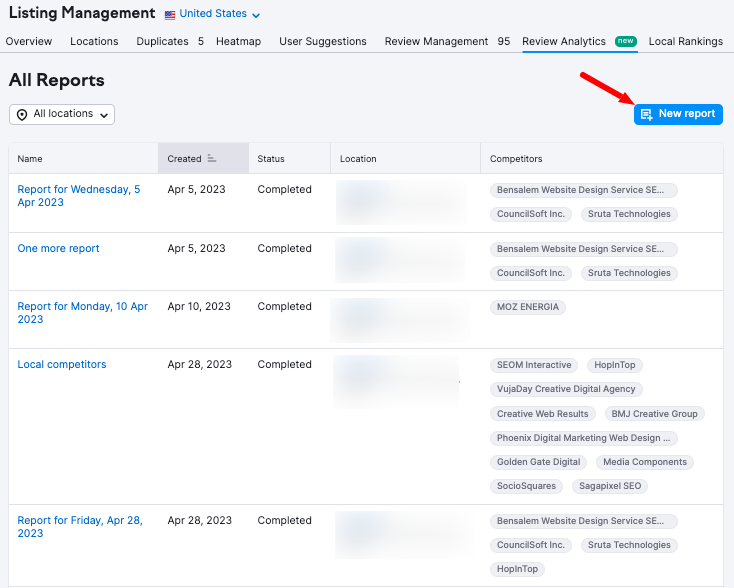
Need to create more reports later on? Access this form at any time by clicking the “New report” button. You can find it at the top right corner of any Review Analytics screen.
How To Read Your Review Analytics Report
A Review Analytics report contains four sections.
First, the report header contains basic information about the report itself, including:
- The report date
- The location name and address associated with the report
- The number of competitors included
- The rerun report button
- The new report button
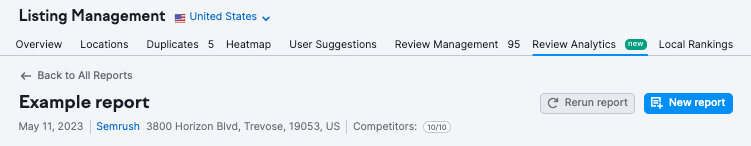
If you click your location name, you will be directed to its main Listing Management page report.
Click “Rerun report” to refresh the information in the report. Click “New report” to create a fresh report, as described in the How To Create A New Report section above.
Below the header is the overview chart, which displays rating and review benchmarks for each business in the report (you and each of the competitors you’ve entered), as well as average metrics for the entire list.
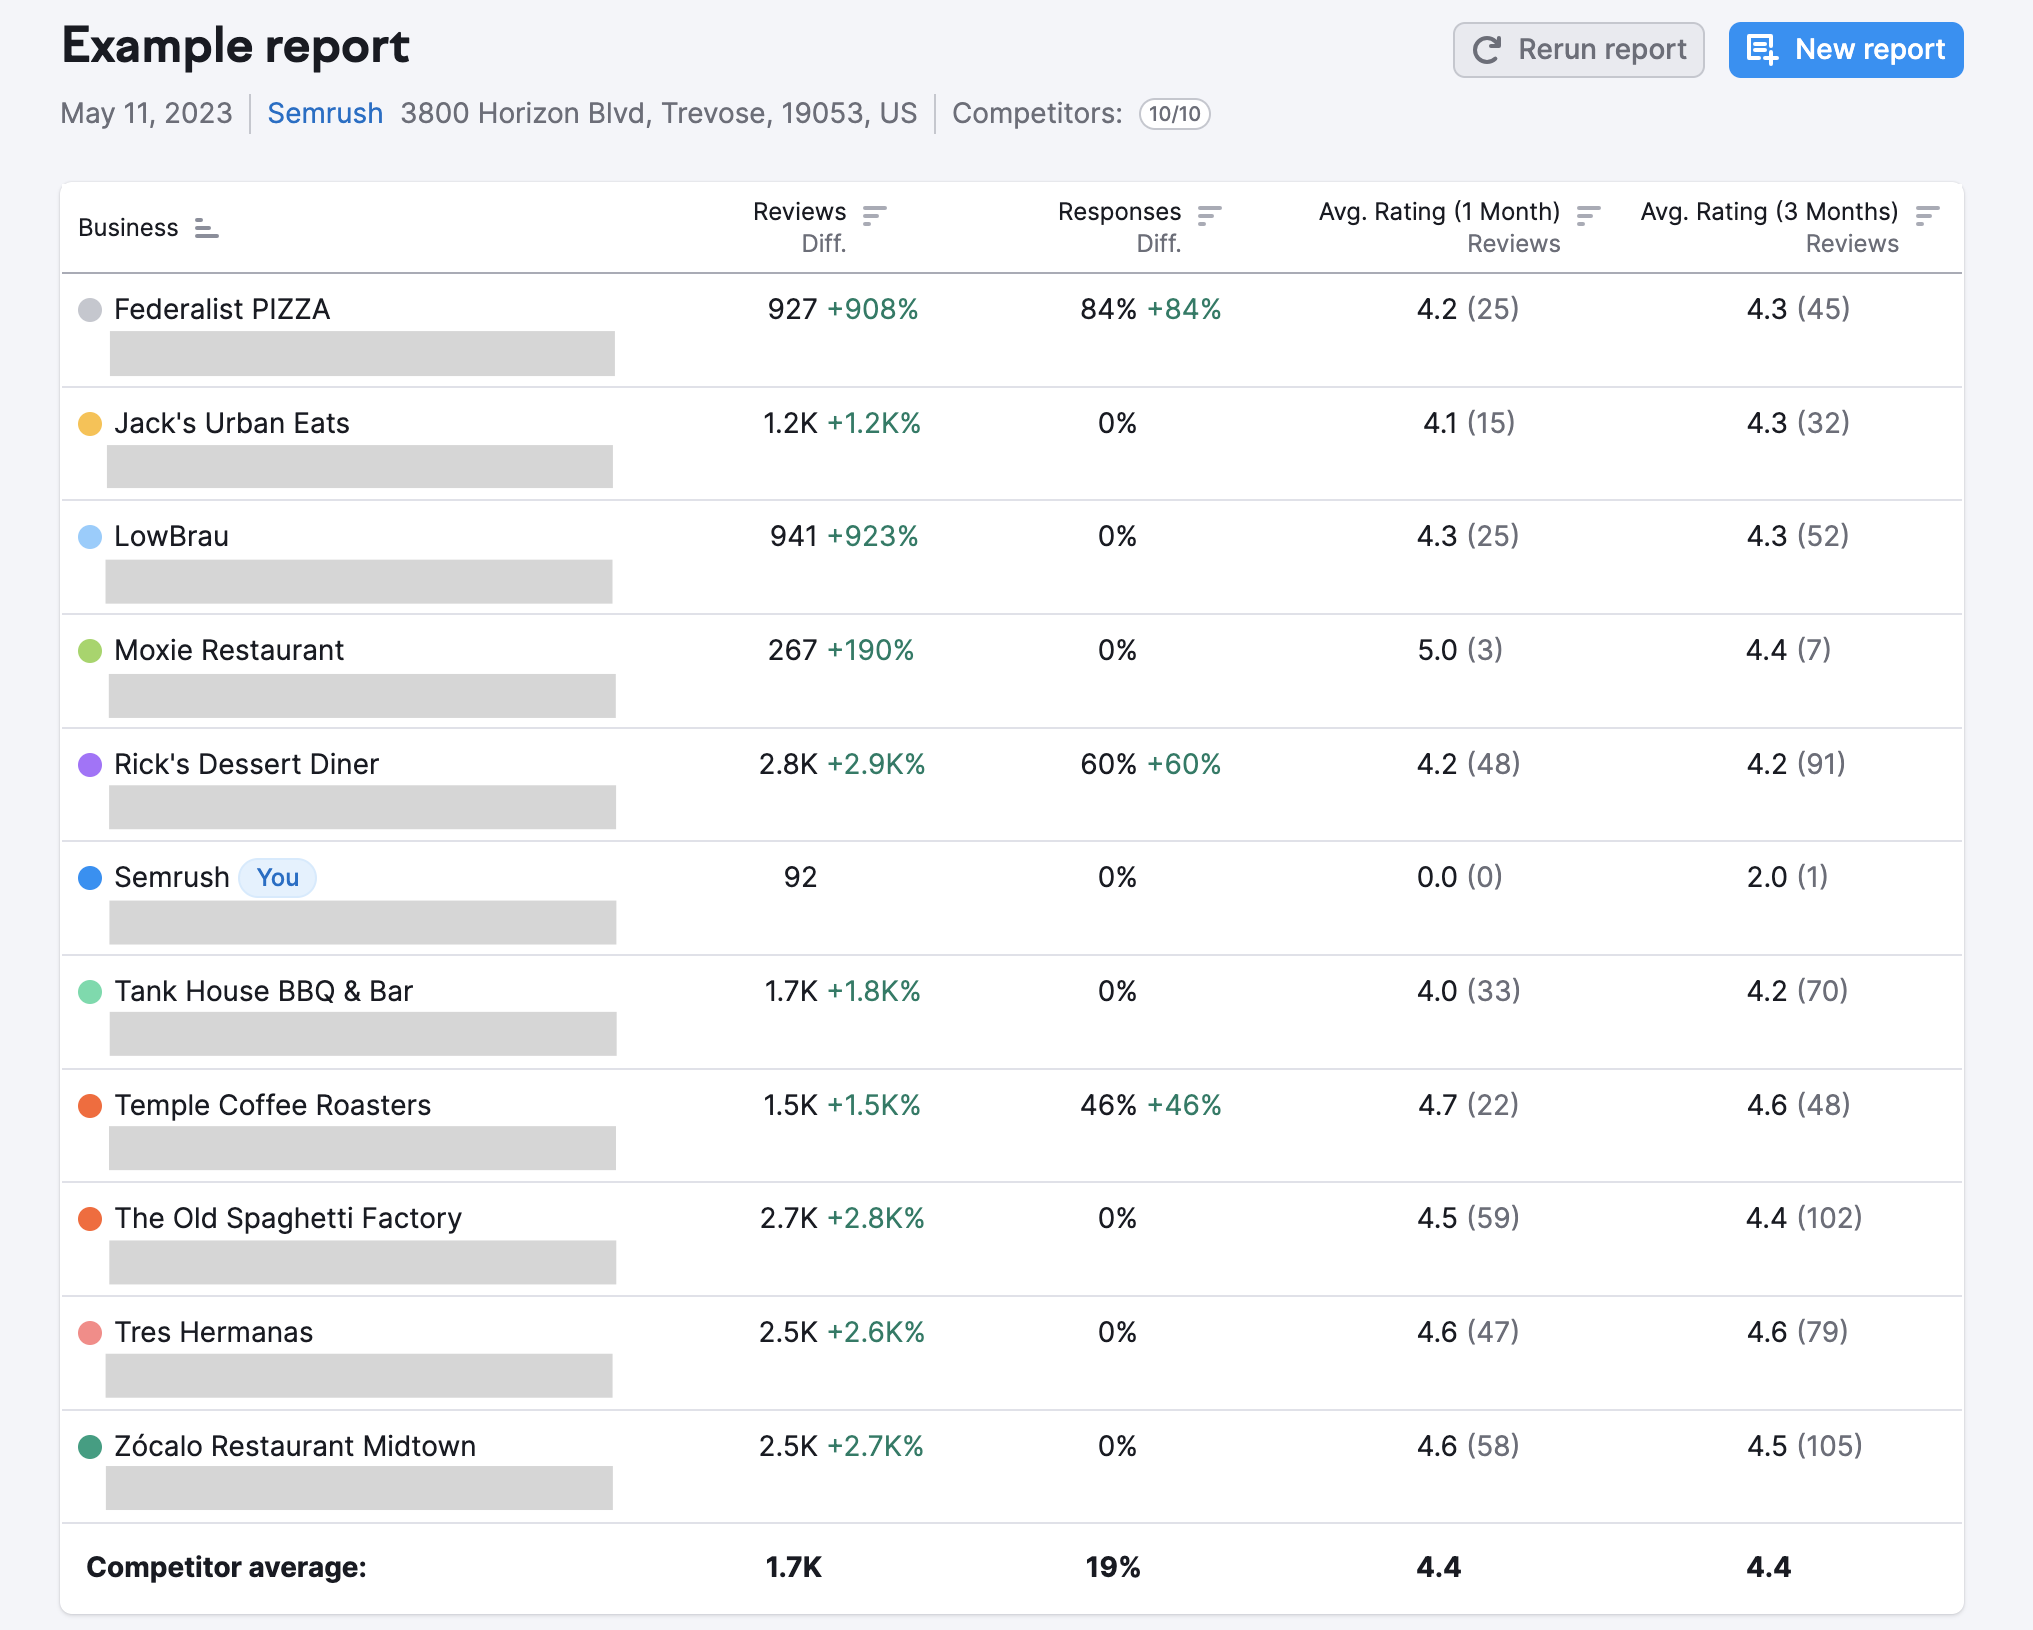
This chart is broken into five columns:
- Business: The name and address of each business reported on
- Reviews: The total number of reviews earned by each business; for competitors, the green or red percentage indicates the difference between their number of reviews and yours
- Responses: The rate of review responses for that business, and each competitor’s difference compared to yours
- Avg. Rating (1 Month): The average rating earned over the previous month, followed by the total number of ratings in parentheses
- Avg. Rating (3 Months): The average rating earned over the previous three months, followed by the total number of ratings in parentheses
At the bottom of the chart, in bold, you’ll find the average number of reviews, review responses, and average ratings among all competitors.
Next, the Most Relevant Reviews widget enables you to analyze the full text of the top-five most relevant reviews and responses in Google Business for each competitor. Click on a business’s name in the left column to see its most relevant reviews.
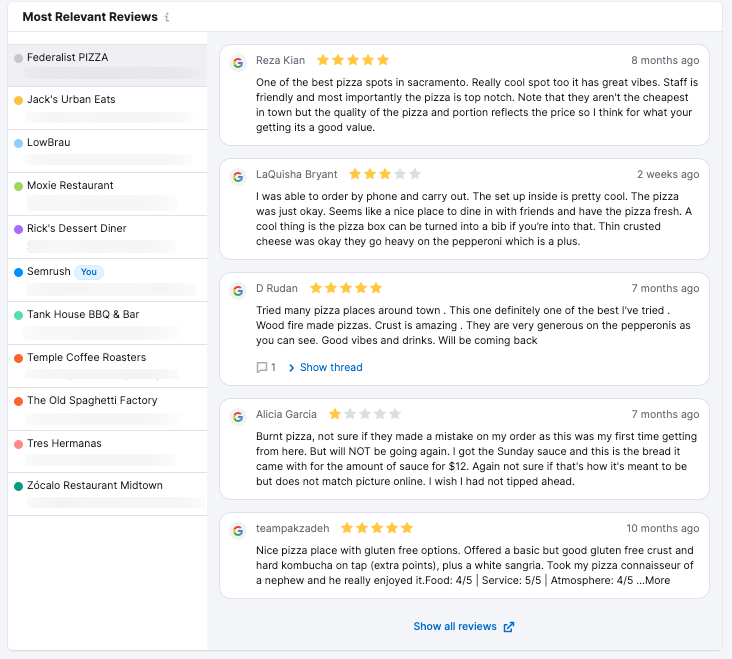
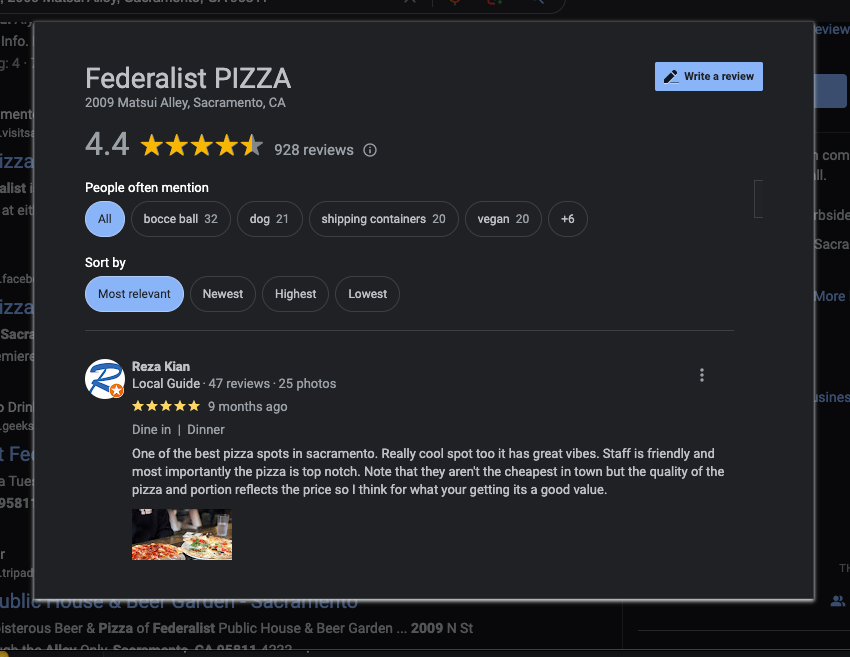
A review’s relevancy aligns with how Google ranks the reviews in their feed. To see all reviews or sort them by rating or recency, click “Show all reviews.” This will open the full review feed on Google in a new tab.
The final section of the Review Analytics report is the Categories widget. This widget shows basic, color-coded information about your business and each competitor.
Color coding is explained in a key at the top of the chart. Information unique to your business is shaded in blue. Any information that matches between you and a competitor is shaded in gray. Unique attributes to each business are not shaded.
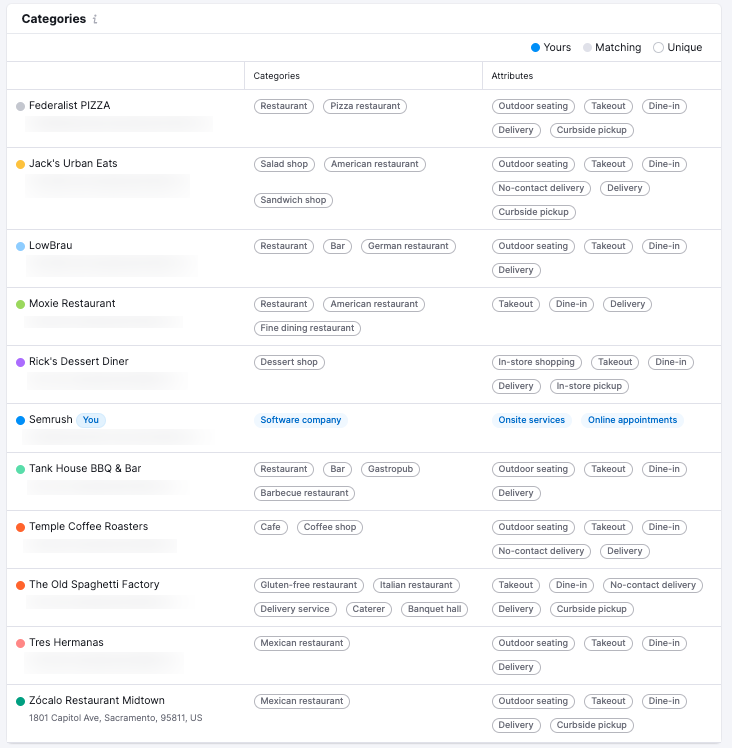
This information is laid out in a three-column chart. Column one contains the business’s name and address.
Column two contains the categories the business operates in. For example, a pizza restaurant might fall under the categories of “restaurant” and “pizza restaurant.”
Column three shows other attributes of the business in question. These could be the types of services offered or other qualities searchers might look for. Examples include no-contact delivery services, table seating, and on-site or online service.
Using the All Reports Dashboard
The All Reports dashboard shows all of the Review Analytics reports you’ve previously created.
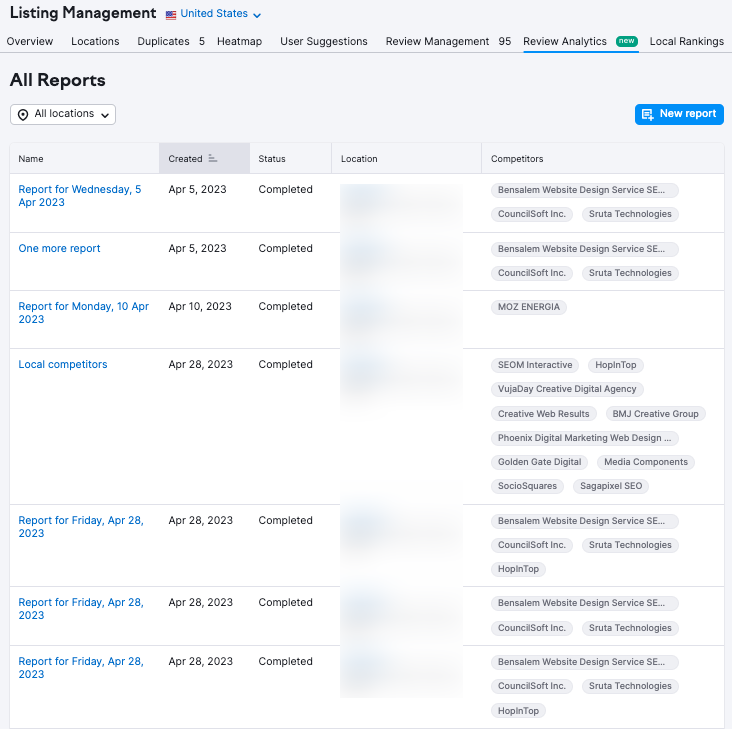
The dashboard is displayed as a five-column chart. From left to right:
- Name: The name of the report. By default, this is named for the date it was created. However, you can customize this when creating a new report.
- Created: Shows the date the report was created
- Status: Shows whether a review is completed or still processing
- Location: Shows which Listing Management Location the report is associated with
- Competitors: Which businesses are included in the report alongside yours (you may include up to 5 for Basic locations and up to 10 for Premium locations)
To review a report in detail (as described in the section above), click on the report name.