What Are the Core Web Vitals?
Google’s Core Web Vitals are a collection of metrics that indicate how user-friendly a website is based on its load time, visual stability, and interactivity.
The Google Core Web Vitals include:
- Largest Contentful Paint (LCP): Measures how long it takes for the largest content element on the page to load
- Cumulative Layout Shift (CLS): Measures how much the page layout moves around unexpectedly as it loads. Like images or buttons shifting.
- Interaction to Next Paint (INP): Measures how much time it takes from when a user initiates any interaction to when the next visual update is displayed
The better a page performs according to these metrics, the better the experience it provides.
In this article, we’ll explain the relationship between the Core Web Vitals and SEO, each of the metrics’ recommended thresholds, and how to check your site’s performance.
Then, we’ll show you how to improve your scores.
Why Are the Core Web Vitals Important?
Strong Core Web Vitals performance ensures a good user experience that’s smooth, fast, and stable. And also improves your SEO.
People are more likely to stay (and potentially convert to customers) on a site that works well and responds to their requests quickly. That’s why faster-loading sites tend to have lower bounce rates.
Google also considers the Core Web Vitals in its ranking factors.
So, optimizing these metrics can improve your site's performance in search rankings. And drive more traffic to your site
What Are the Recommended Thresholds for Core Web Vitals Metrics?
Let’s look at what what thresholds Google recommends for each metric:
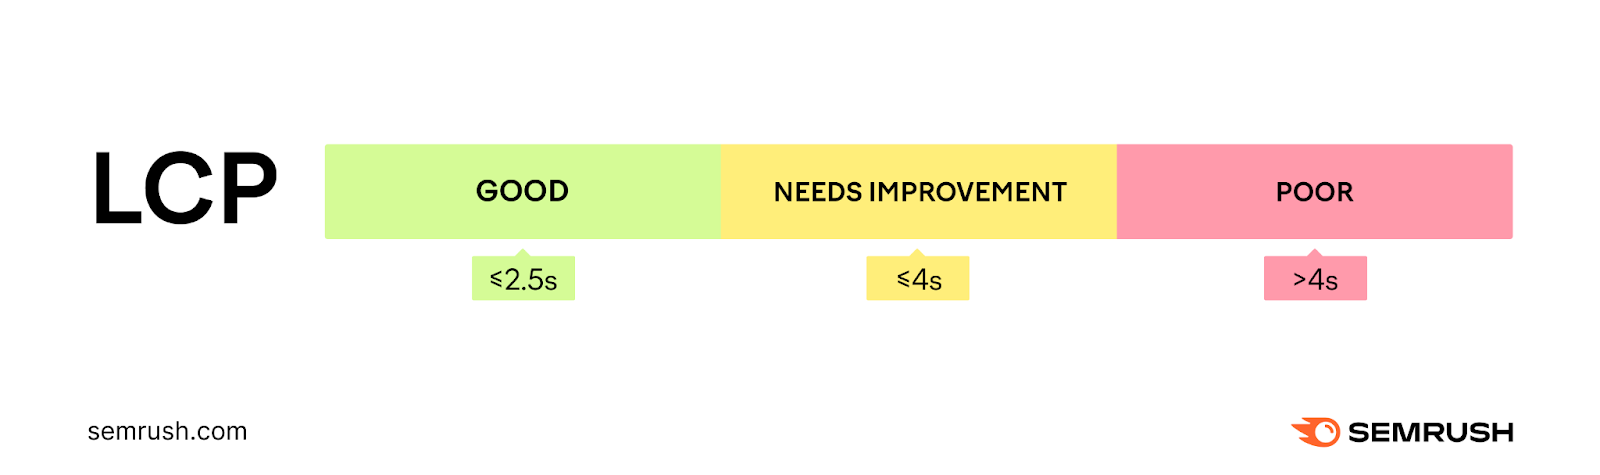
Largest Contentful Paint
LCP reflects how quickly users can see your page’s content. And is measured in seconds.
A good LCP is 2.5 seconds or less. This means the main image, video, or large block of text loads almost immediately when someone lands on the page.
An LCP of between 2.6 and 4 seconds means your site speed needs improvement.
And a poor LCP is anything over 4 seconds. Because it can frustrate visitors, making them more likely to leave your site.
Further reading: Largest Contentful Paint (LCP): What It Is & How to Improve It
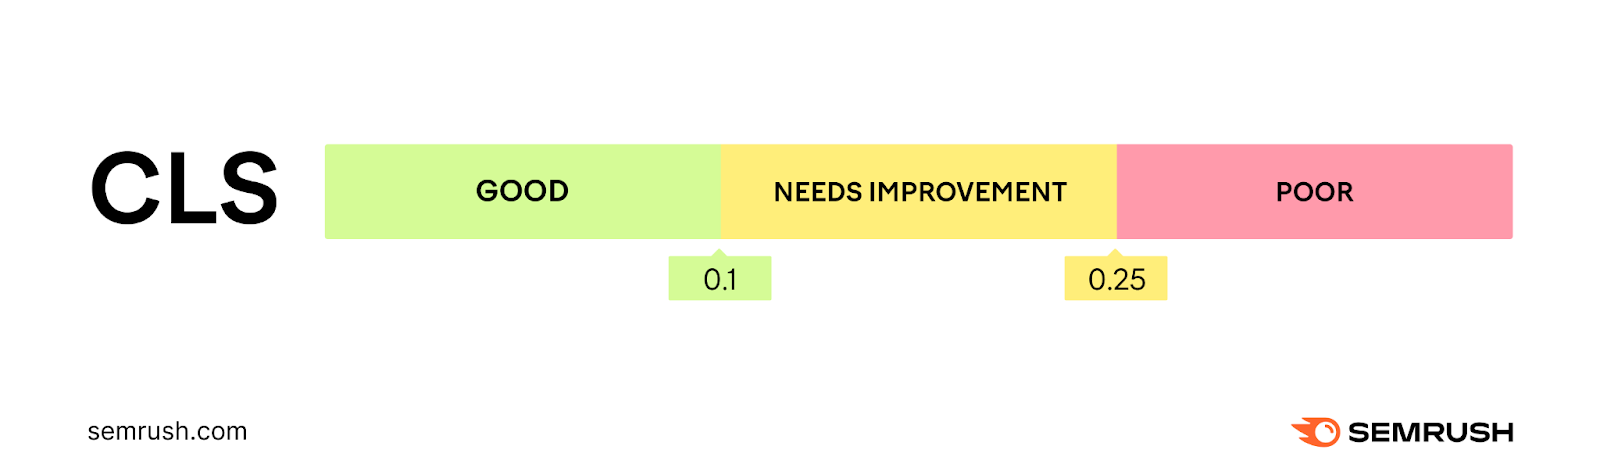
Cumulative Layout Shift
CLS reveals how much page elements move unexpectedly while the page loads. The metric is expressed as a score.
A good CLS score is 0.1 or less and means your page layout is very stable. This makes it easy for users to view your content without disruptions.
A CLS score between 0.1 and 0.25 means your site’s visual stability needs improvement. There’s enough shifting that it’s noticeable to users.
A poor CLS score is over 0.25 and means your page elements move around a lot. Users could see big jumps like text or buttons moving unexpectedly. Which is disruptive to their experience.
Further reading: What Is CLS? How (and Why) to Measure It
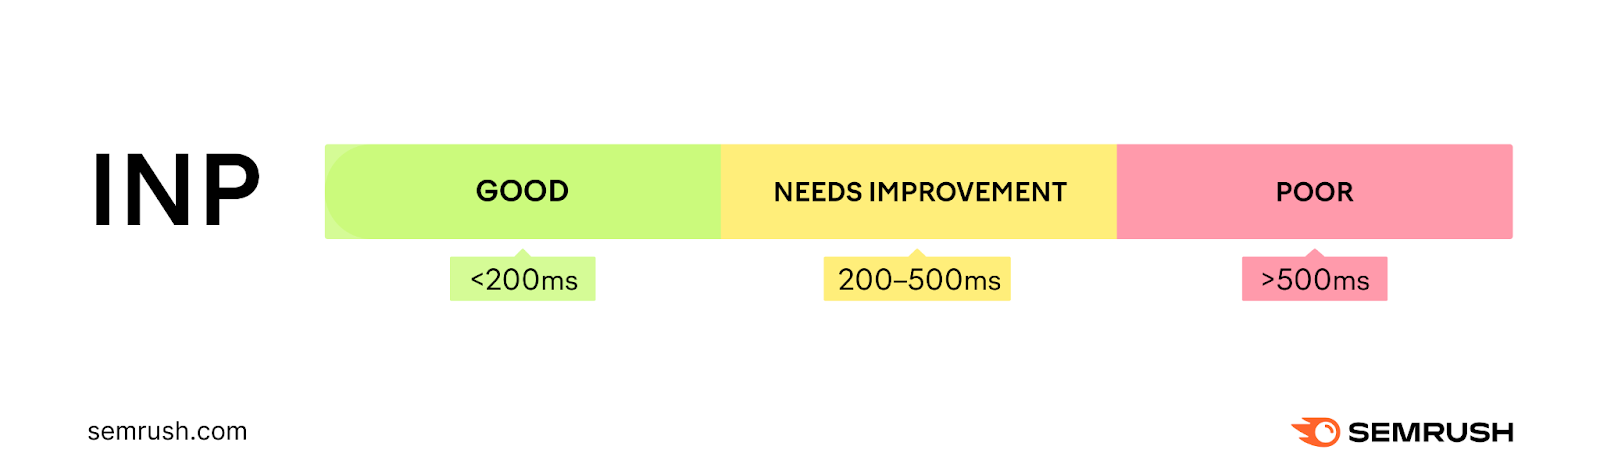
Interaction to Next Paint (INP)
INP is the newest Core Web Vitals metric that replaced First Input Delay (FID) on March 12, 2024. It conveys how quickly a page responds to interactions and is measured in milliseconds.
It’s worth pointing out that INP evaluates how quickly a webpage responds during the whole time a user is interacting with it.
FID only measured the response time for the first user interaction with any element on the site.
So, if a user were on a page and zoomed in on a map, clicked a button, and also opened an accordion, INP considers the time from initiation to the visual change appearing for all those interactions. And is based on the one that takes the longest to give you a more accurate picture of your page’s overall responsiveness.
A good INP is 200 milliseconds or less.
An INP of between 200 and 500 milliseconds means your site’s interactivity needs improvement.
An INP of over 500 milliseconds reflects a poor interactive experience for your users. This means noticeable lags and delays in response to user actions.
How to Check Your Site’s Core Web Vitals Performance
Here’s how you can run a Core Web Vitals test with four different tools:
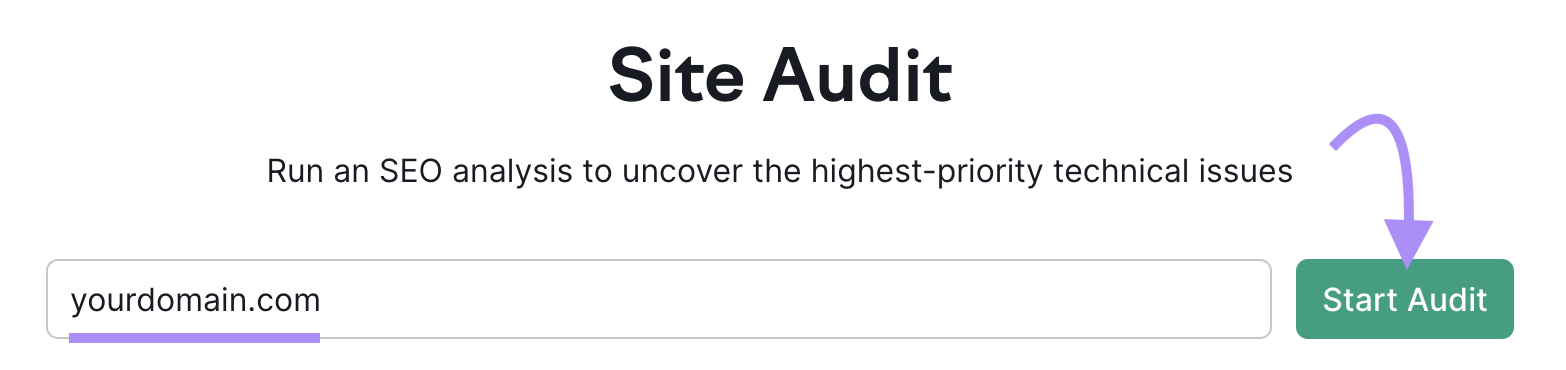
1. Semrush Site Audit
The Semrush Site Audit tool conducts a full technical check-up of your site and highlights issues that could impact its health.
To measure your Core Web Vitals performance, open Site Audit, enter your domain in the search bar, and click “Start Audit.”
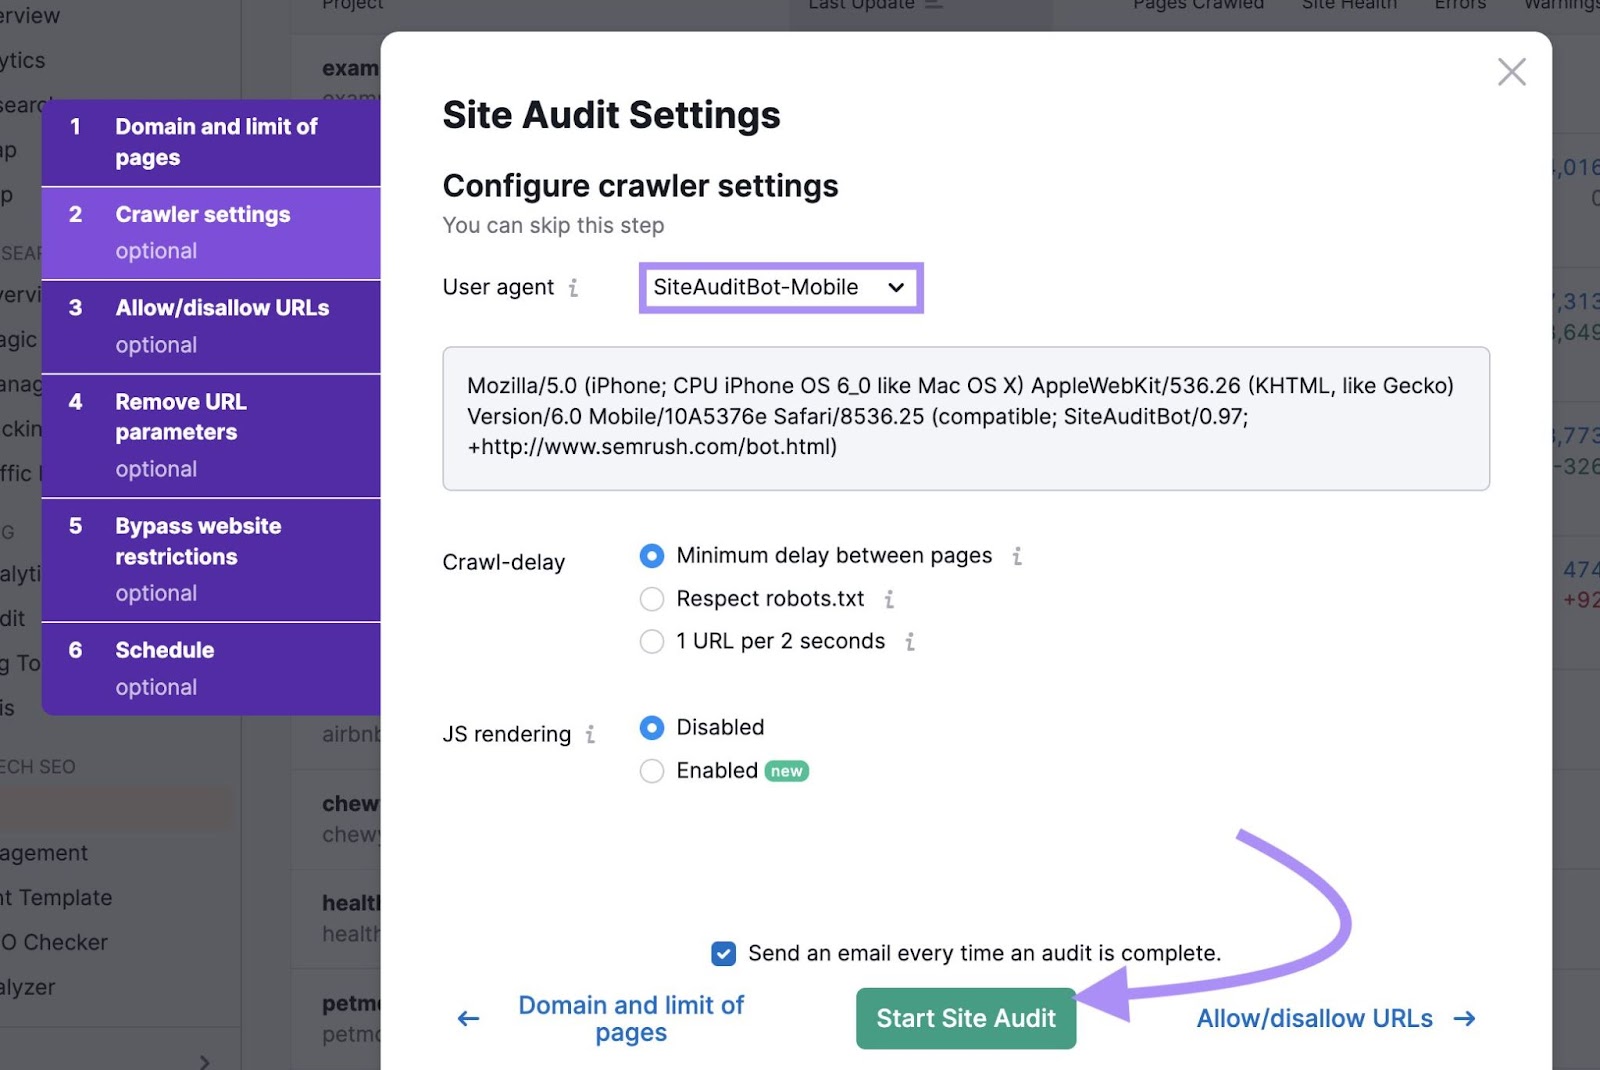
Next, you’ll be asked to customize your audit settings.
For example, click on the “Crawler settings” section to choose whether the tool should analyze the mobile or desktop version of your site.
Once you’re done, click “Start Site Audit.”
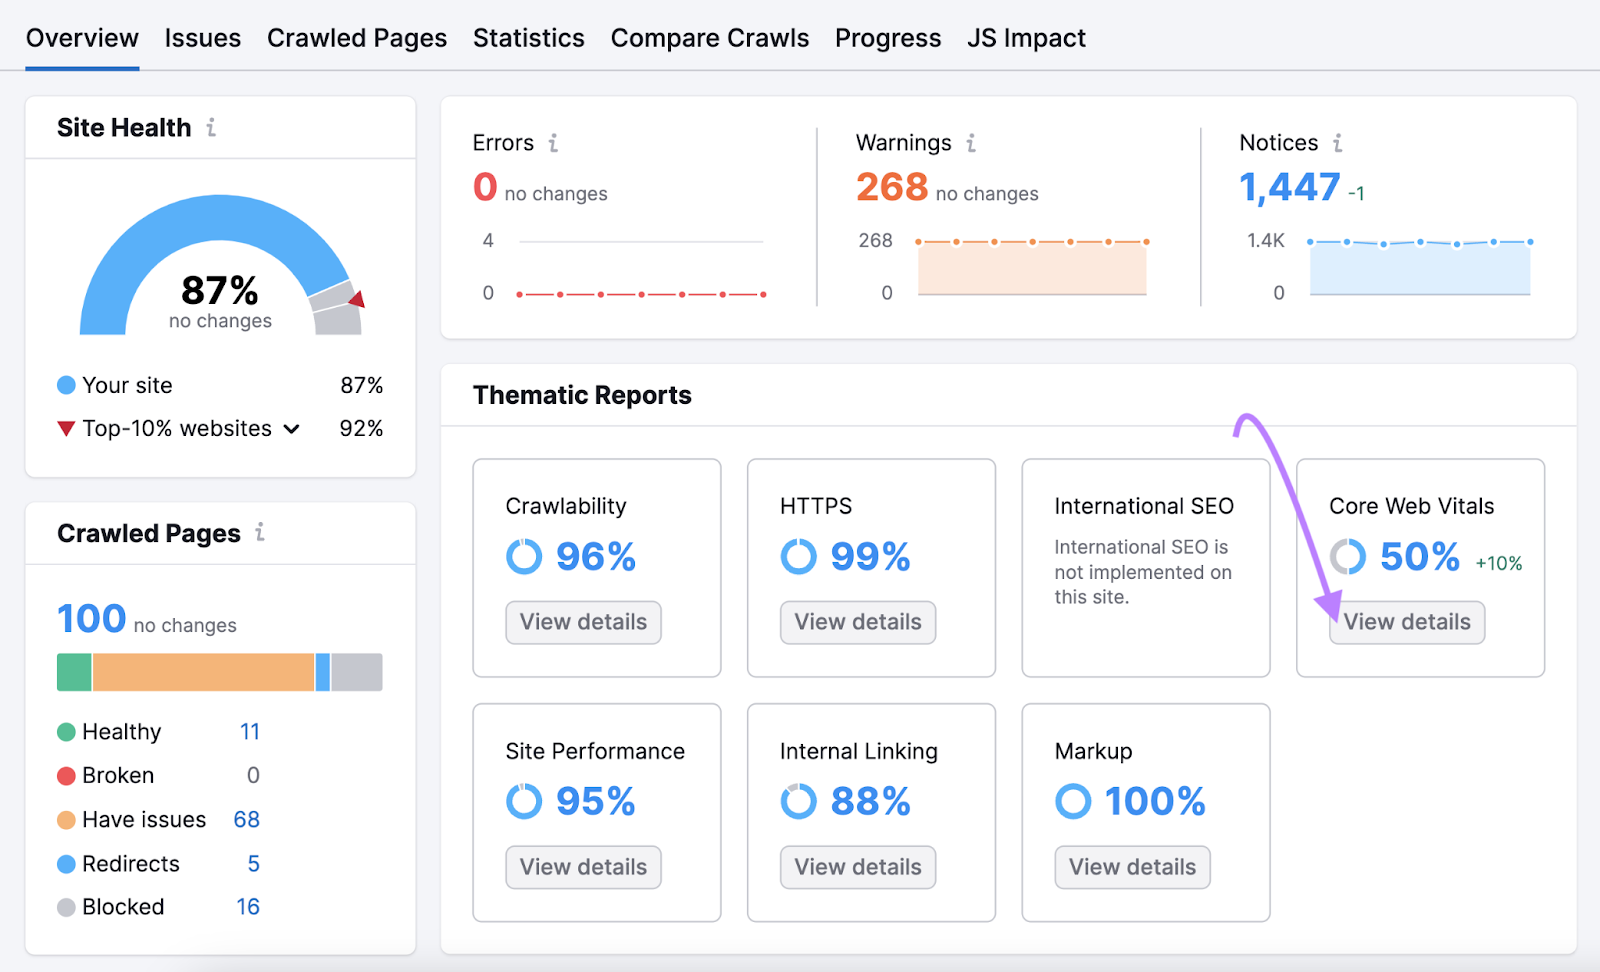
Once the audit is ready, you’ll see an “Overview” report like the one below.
Under “Thematic Reports,” you’ll find the “Core Web Vitals” section. Click “View details” for a comprehensive review.
You’ll see your pages’ statuses along with data on your historical performance.
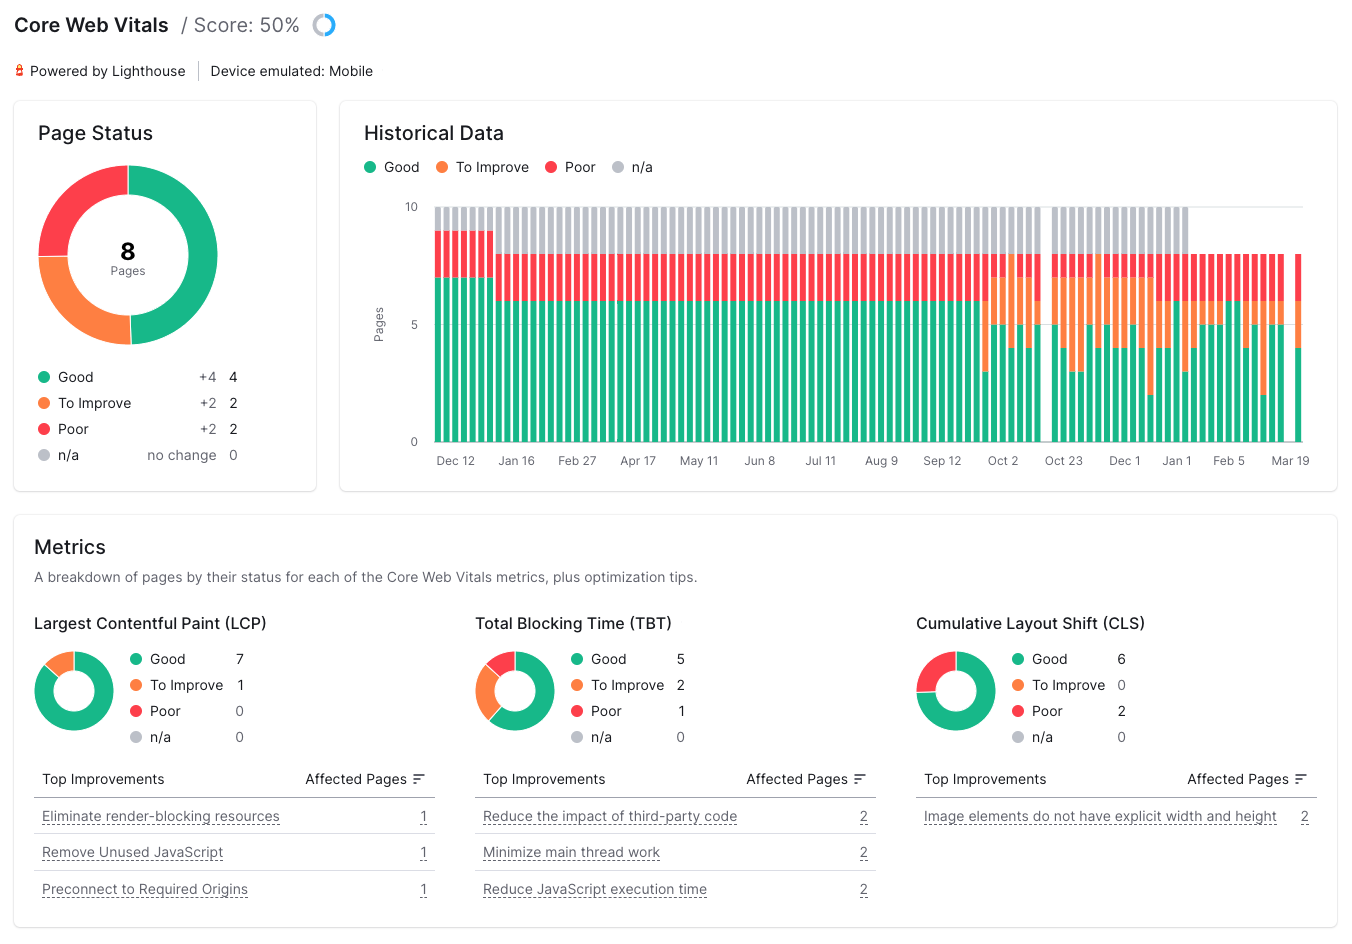
Scroll down to the “Metrics” section to see your LCP and CLS scores, along with a list of recommendations on how to improve them.
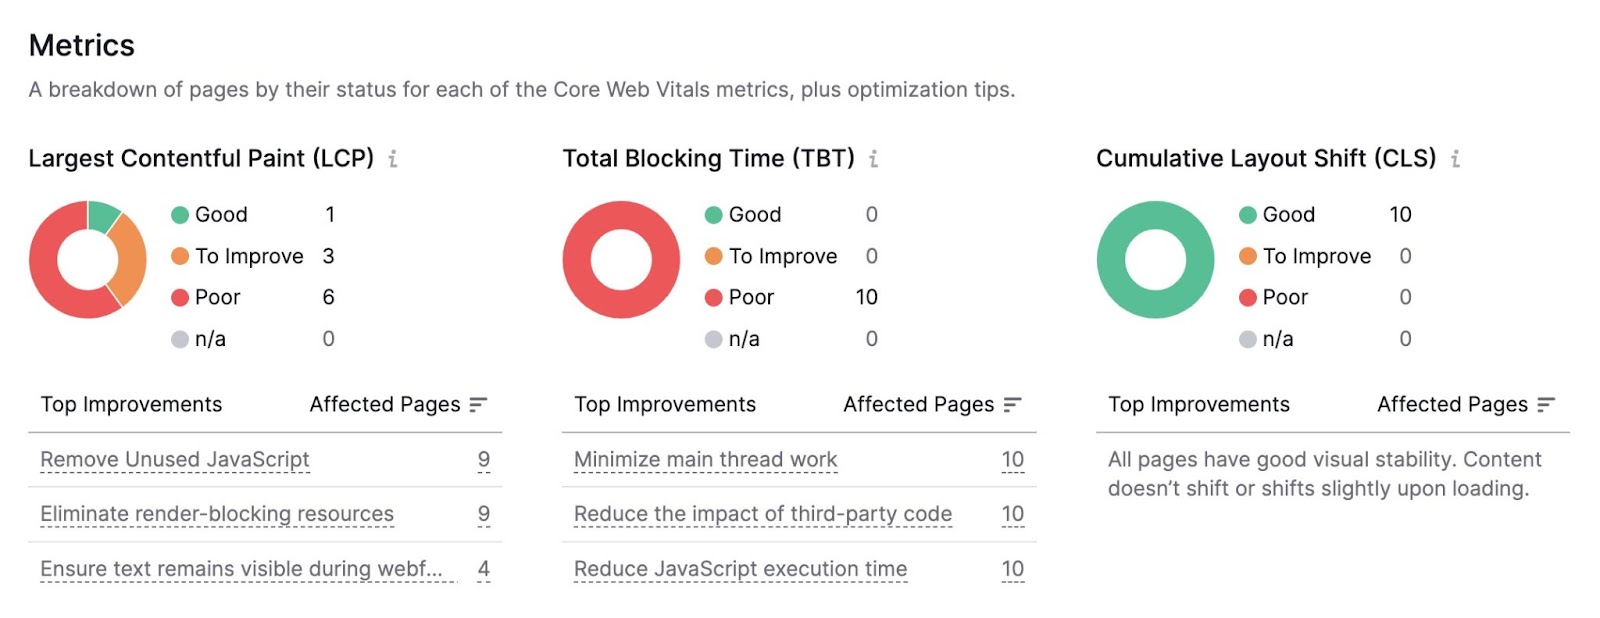
You’ll also see a metric called Total Blocking Time (TBT). Which can be used to assess INP.
Click an issue under one of the “Top Improvements” columns to learn more about how to address it. And select the number under the corresponding “Affected Pages” column to see a full list of pages with the issue.
2. Chrome User Experience Report
The Chrome User Experience Report (CrUX) is a public dataset that gives you insights on how real Chrome users interact with sites.
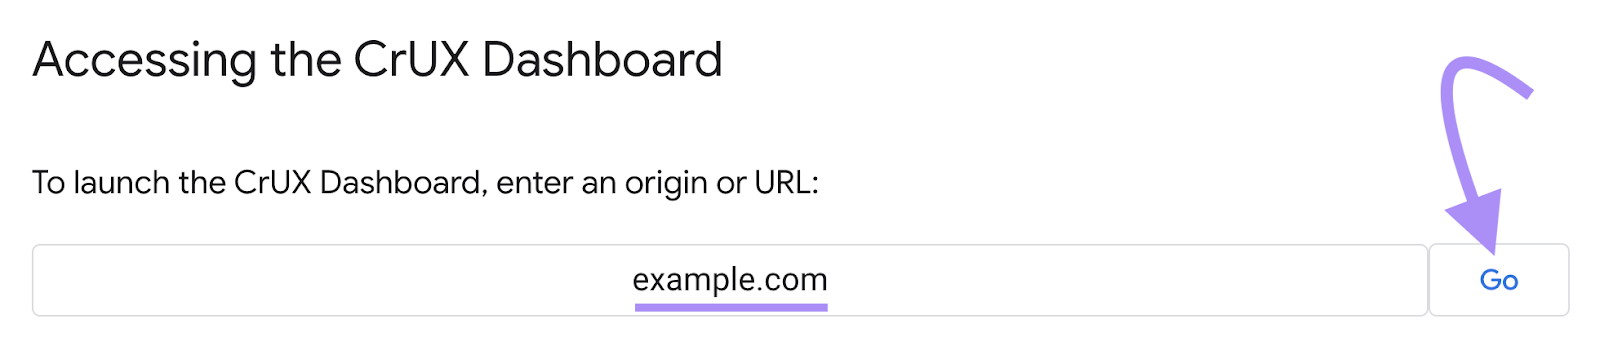
One of the easiest ways to access CrUX is through the CrUX Dashboard for Looker Studio.
Once you’ve opened the tool, enter the URL of the site you want to analyze in the search bar. Then, click “Go.”
You’ll see your results for the Core Web Vitals. But you can also examine other data if you wish.
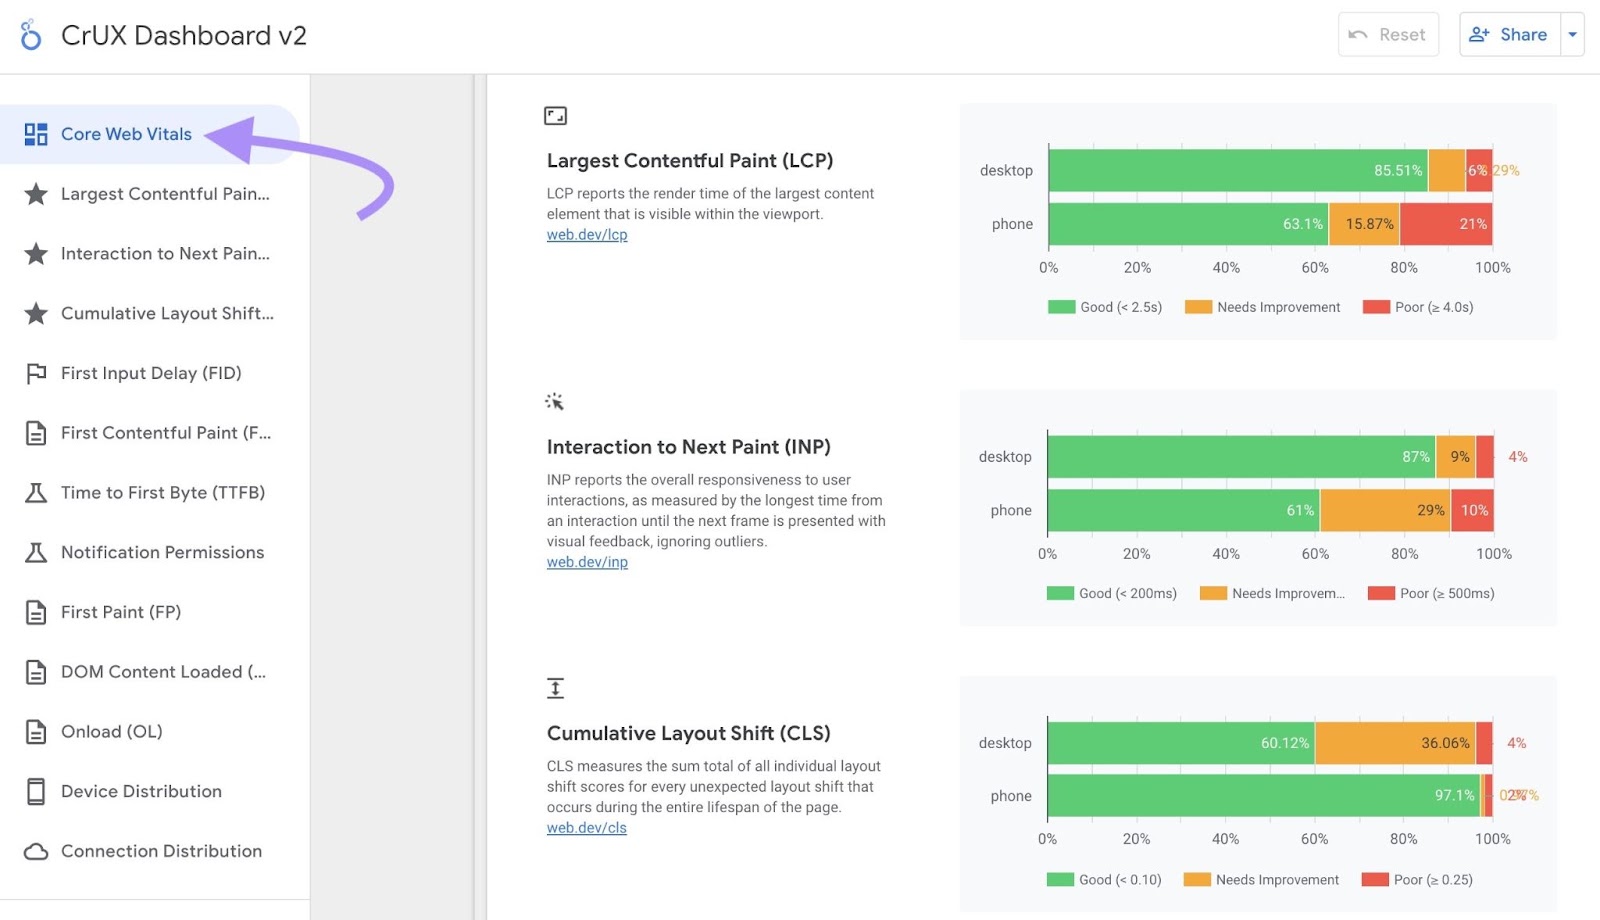
On the dashboard, you’ll see a summary of your pages’ performance for each Core Web Vital. For both mobile and desktop users.
Let’s take a look at the LCP summary as an example.
You can see that 85.51% of desktop experiences were considered good. And that 63.1% of mobile experiences were good.
For a more granular analysis, select the individual reports for the metric you want to review from the left-hand menu.
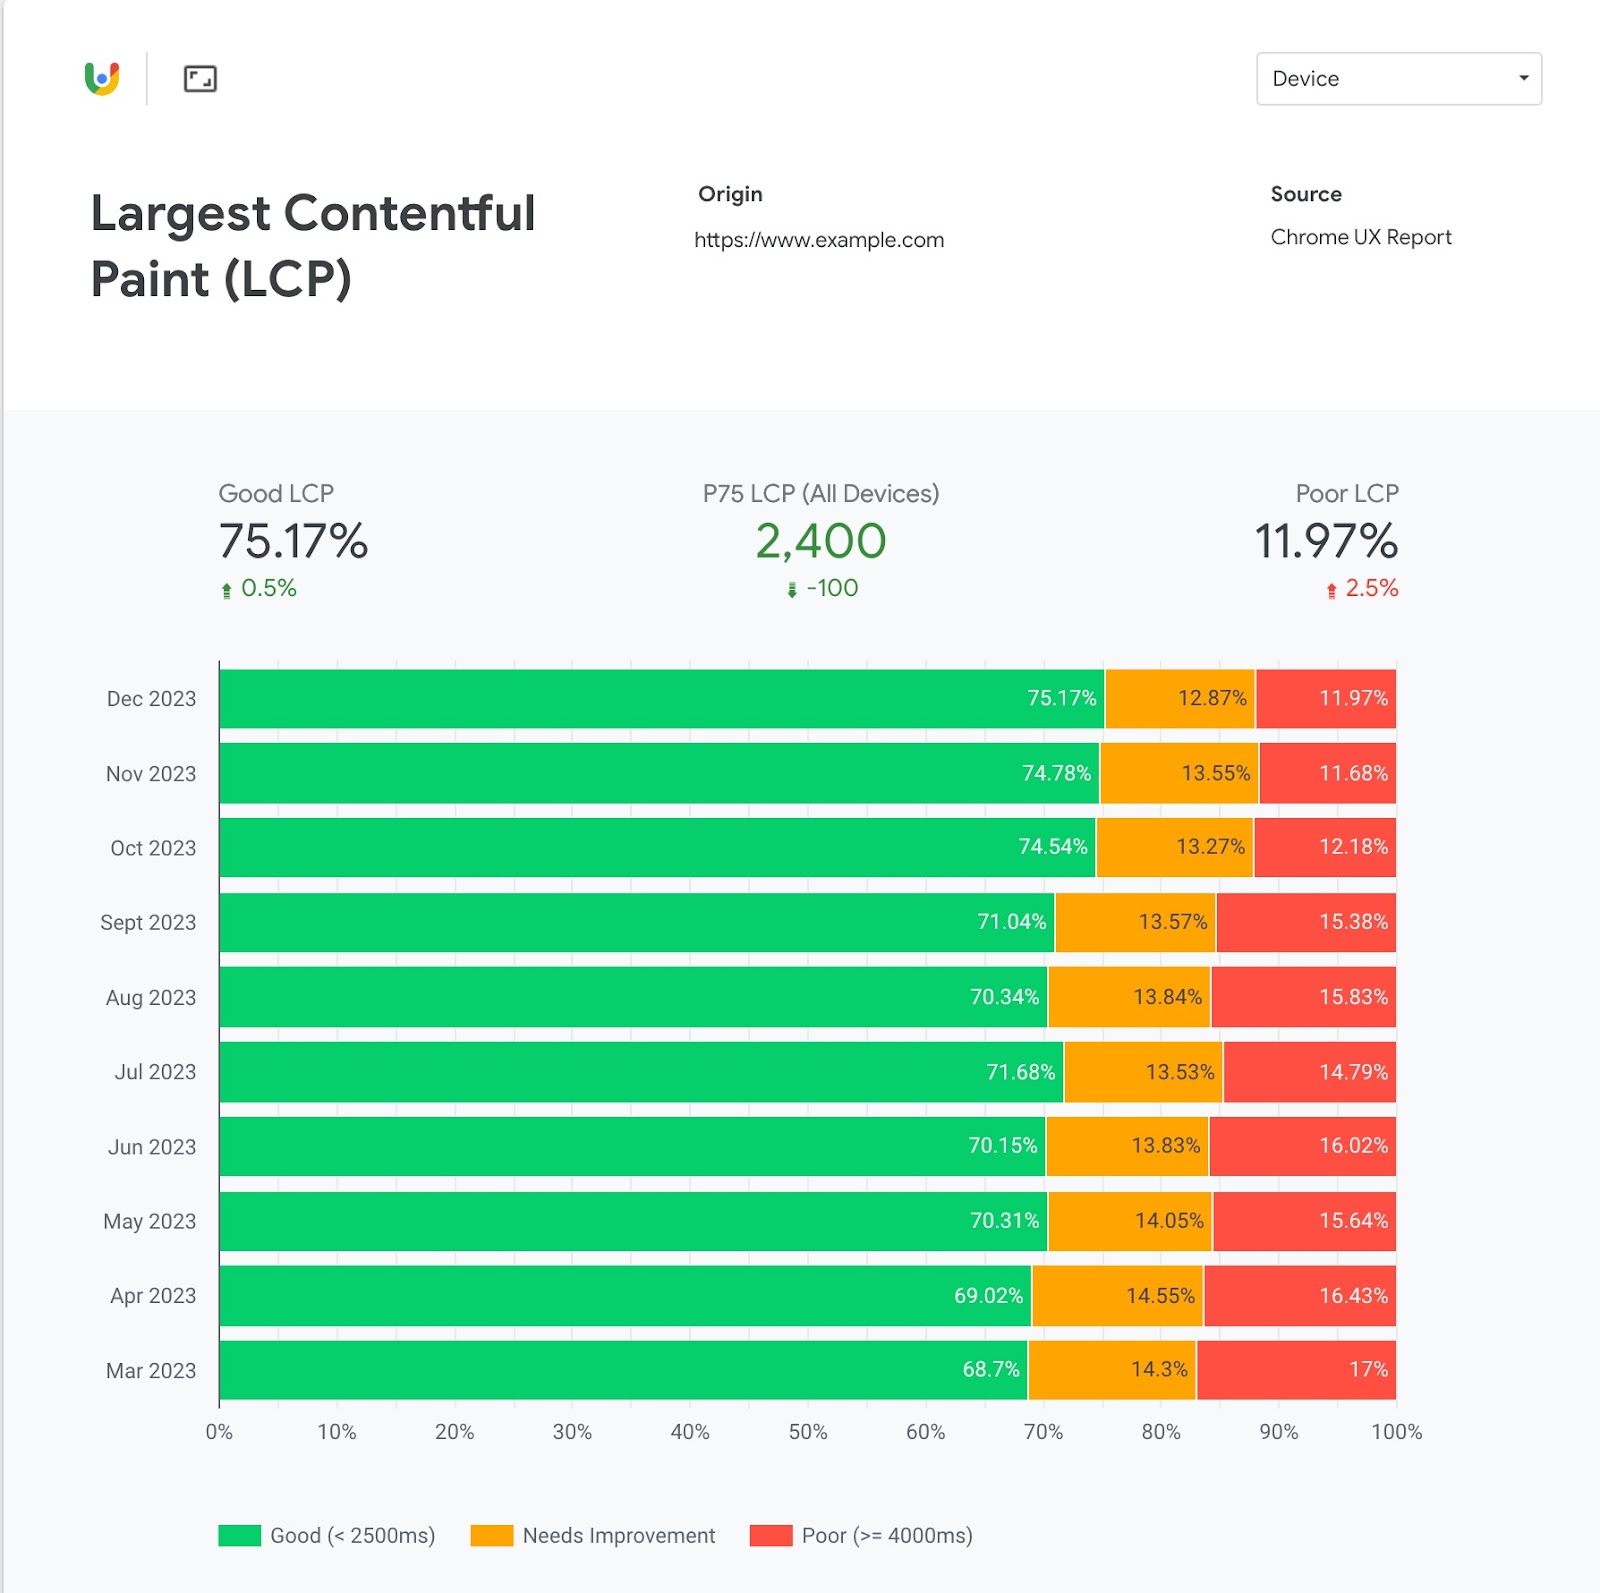
For example, let’s take a look at the “Largest Contentful Paint” report.
Here, you’ll see a detailed breakdown of your site’s LCP by month.
This helps you understand how the metric has changed over time. So you can pinpoint specific periods of improvement or decline.
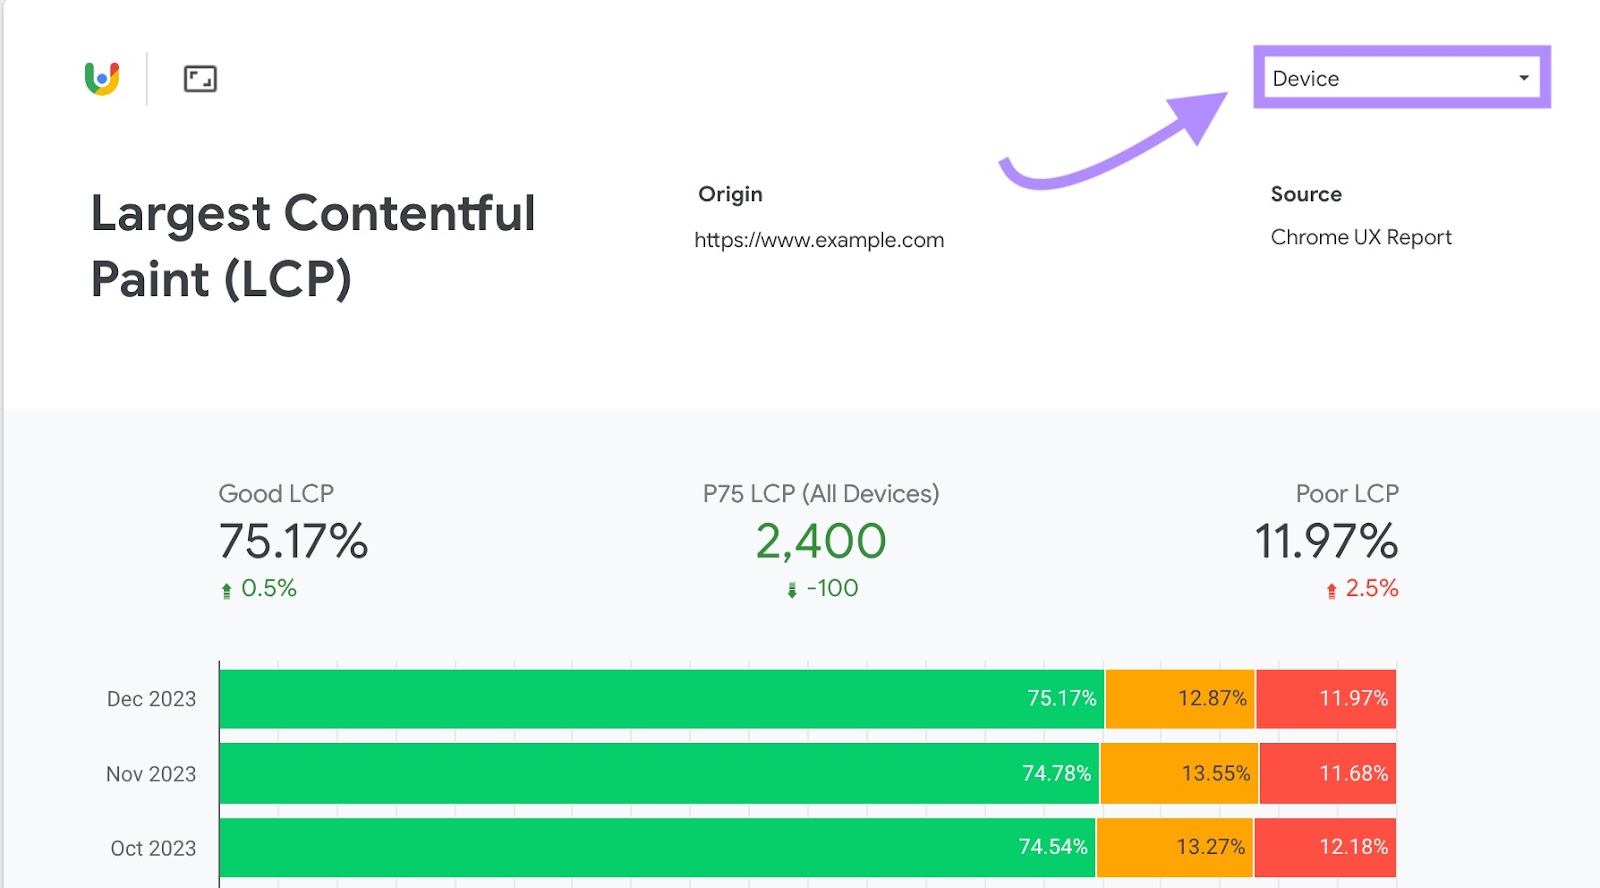
Note that this data represents your performance across all devices. You can choose to view your scores for only mobile or desktop by clicking the “Device” filter in the top right corner and selecting your device type.
3. Google PageSpeed Insights
Google PageSpeed Insights (PSI) is a free tool that evaluates the performance of a single webpage for both mobile and desktop devices.
It also offers ideas on how to make your page faster and easier to use.
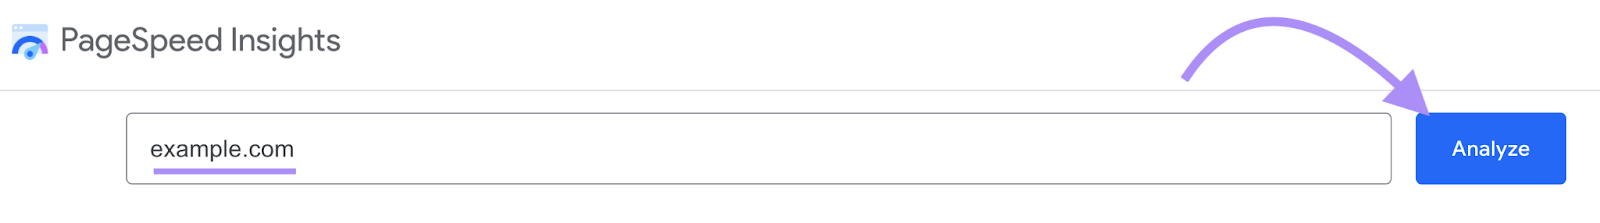
To measure a page’s Core Web Vitals performance, open PageSpeed Insights, enter the URL you want to check, and click “Analyze.”
Once your report is ready, you’ll see a detailed breakdown of your performance across a variety of metrics.
There’s a “Performance” score that ranges from 0 to 100 and is based on these metrics:
- First Contentful Paint
- Speed Index
- Largest Contentful Paint
- Total Blocking Time
- Cumulative Layout Shift
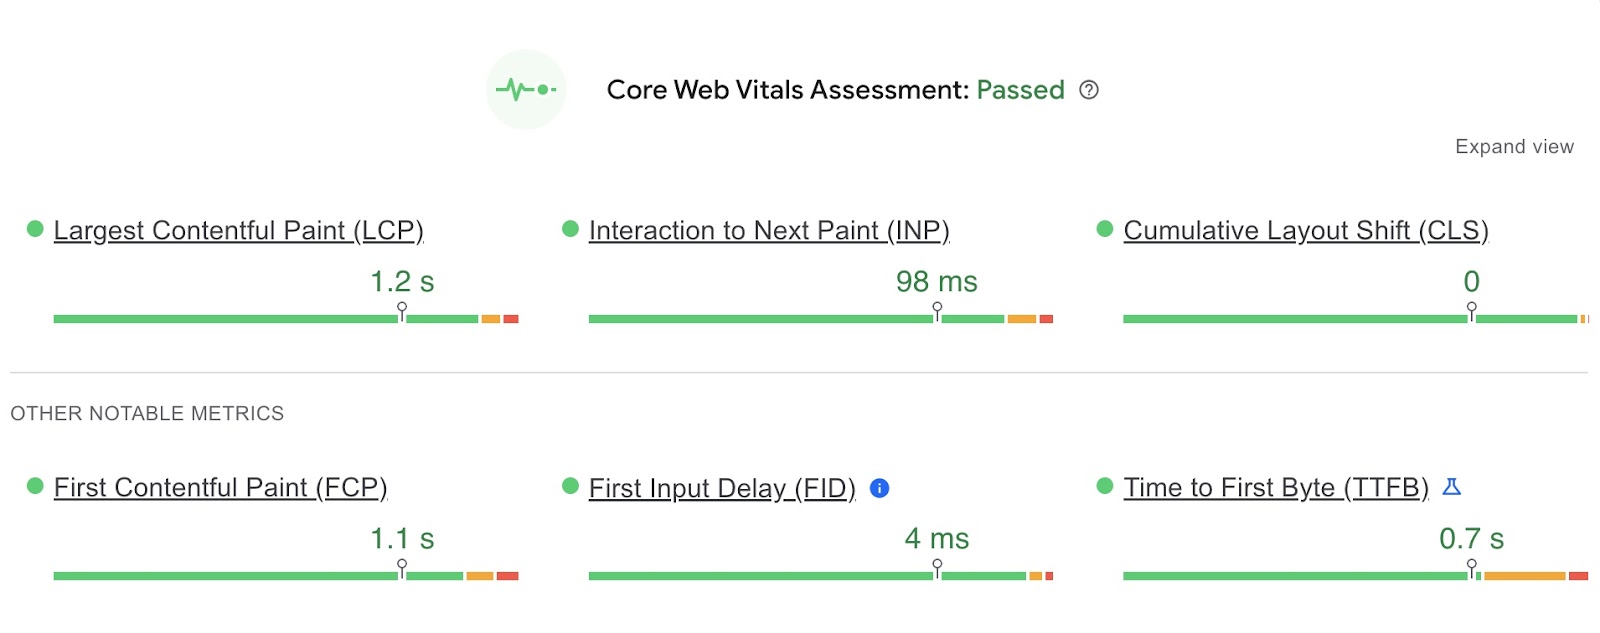
Your Core Web Vitals results will look like this:
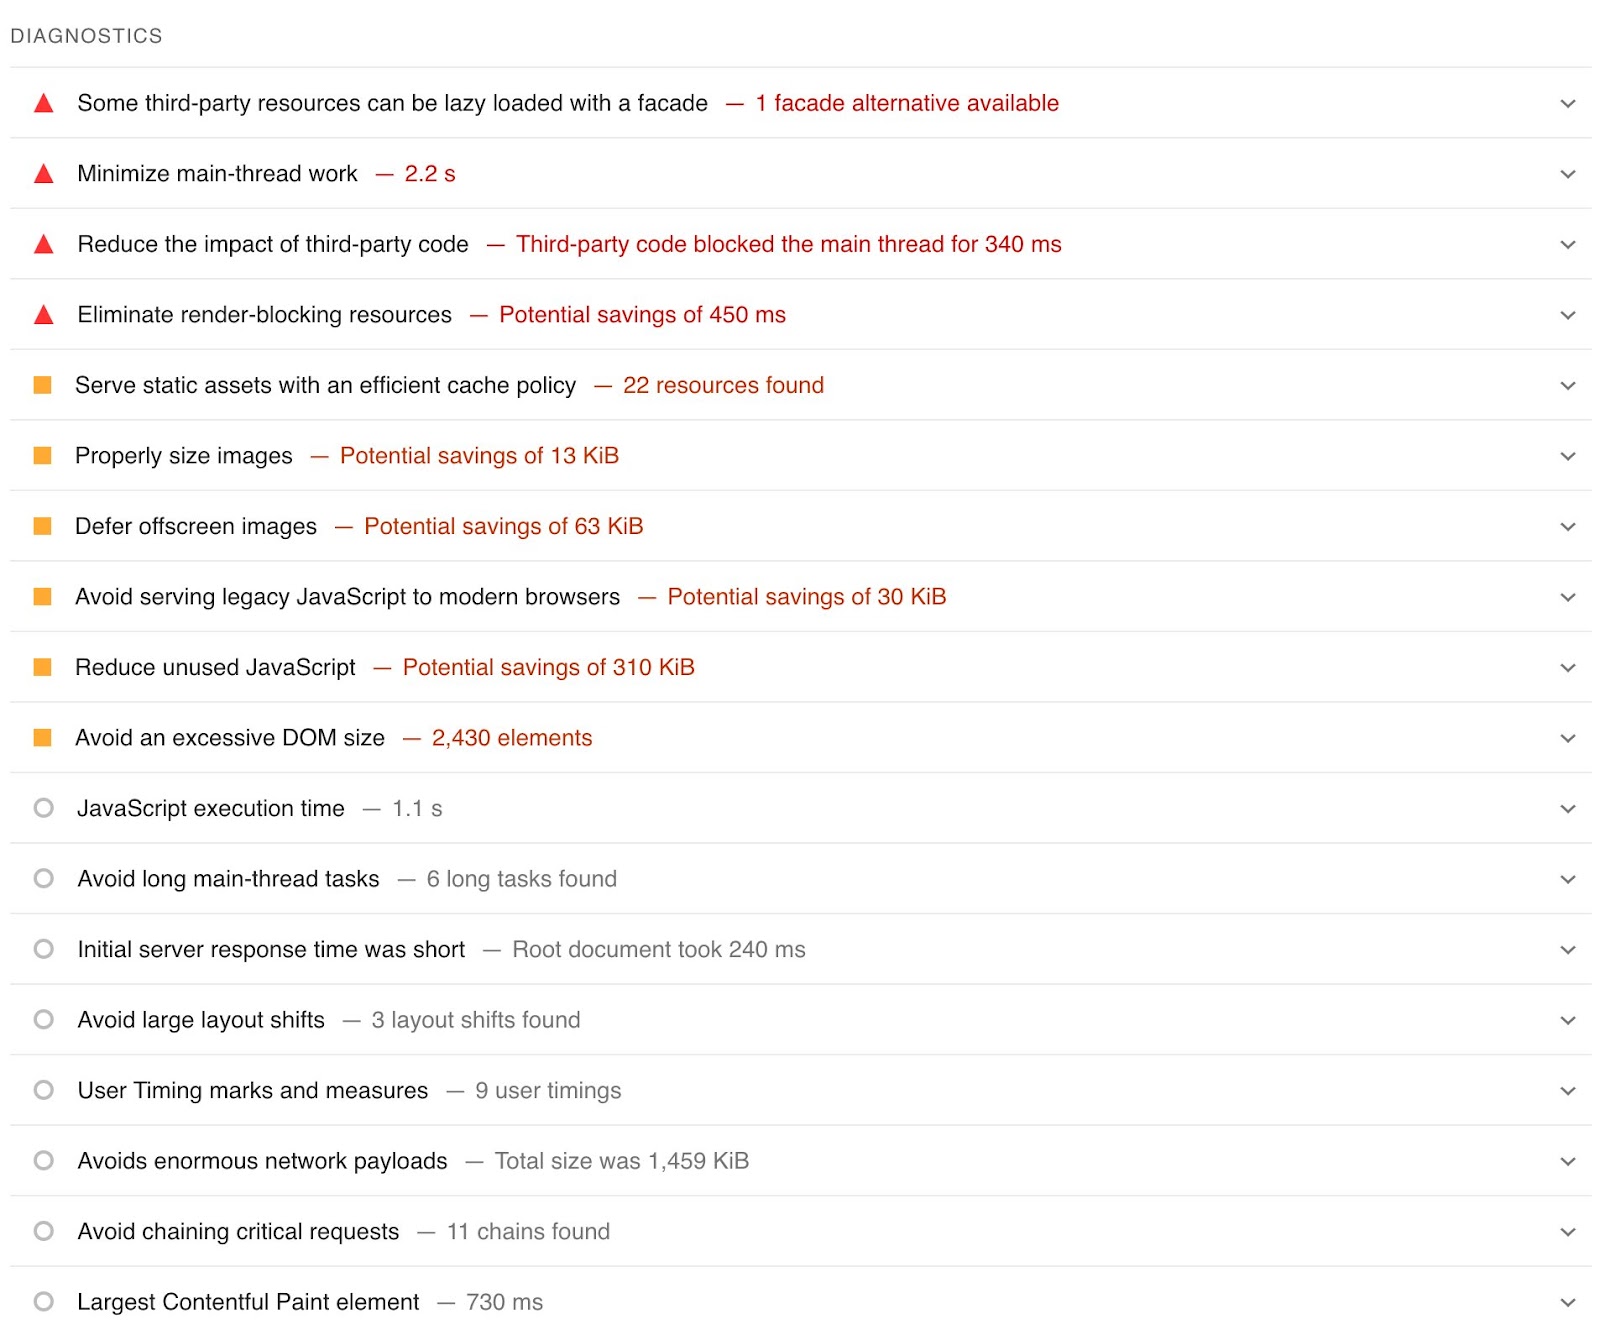
Scroll down to the “Diagnostics” section for lists of things you can do to improve your site’s performance.
PSI also provides insight into your site’s accessibility, SEO performance, and adherence to best practices. Simply scroll down to see those results.
4. Core Web Vitals Report in Google Search Console
The “Core Web Vitals” report in Google Search Console (GSC) uses real-world data to give you an accurate picture of how users experience your site.
And GSC groups together pages from your site with similar problems, making it easier to identify and address common problems across your site.
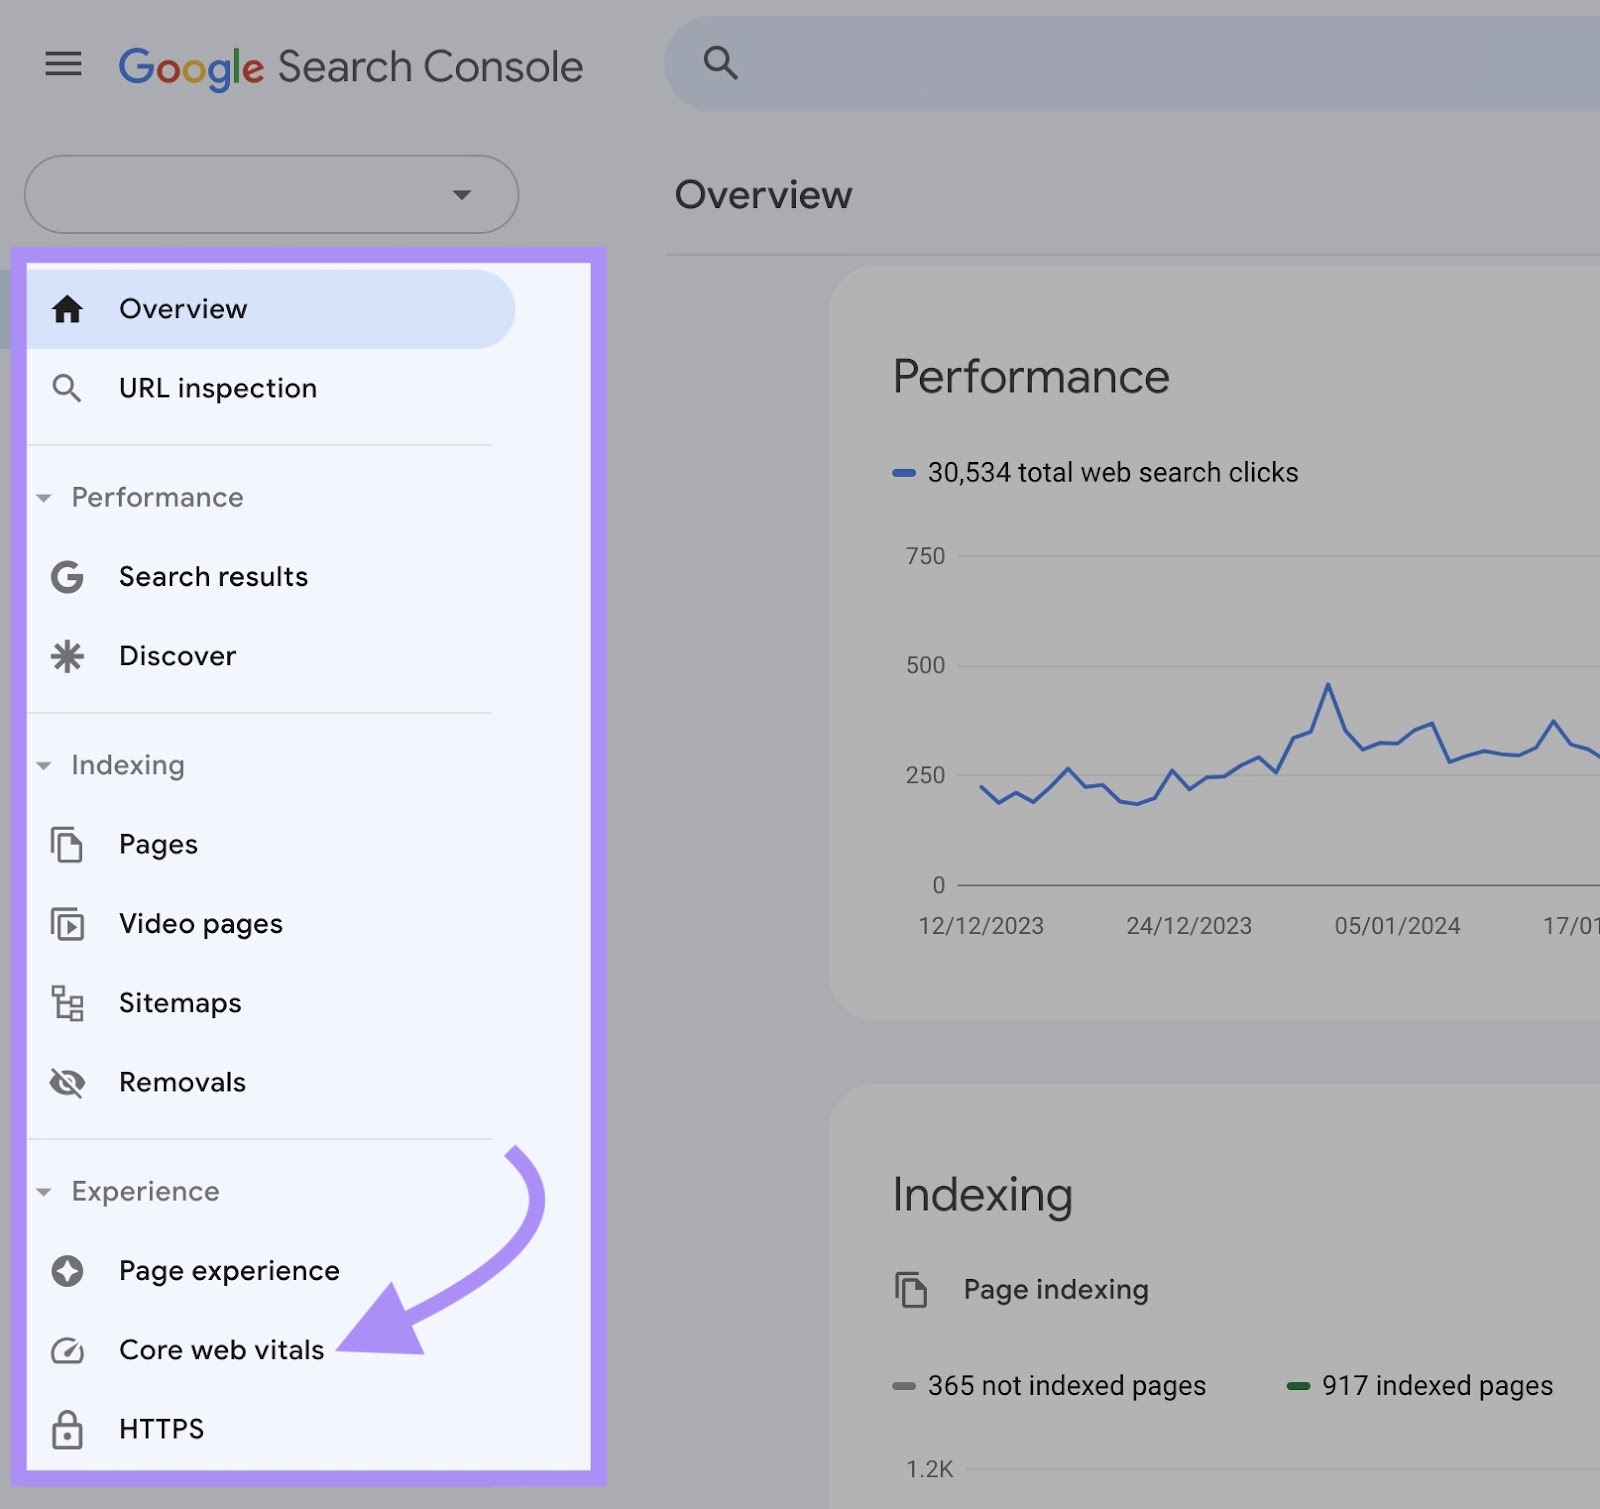
To use this report, sign in to GSC, and select “Core Web Vitals” in the menu.
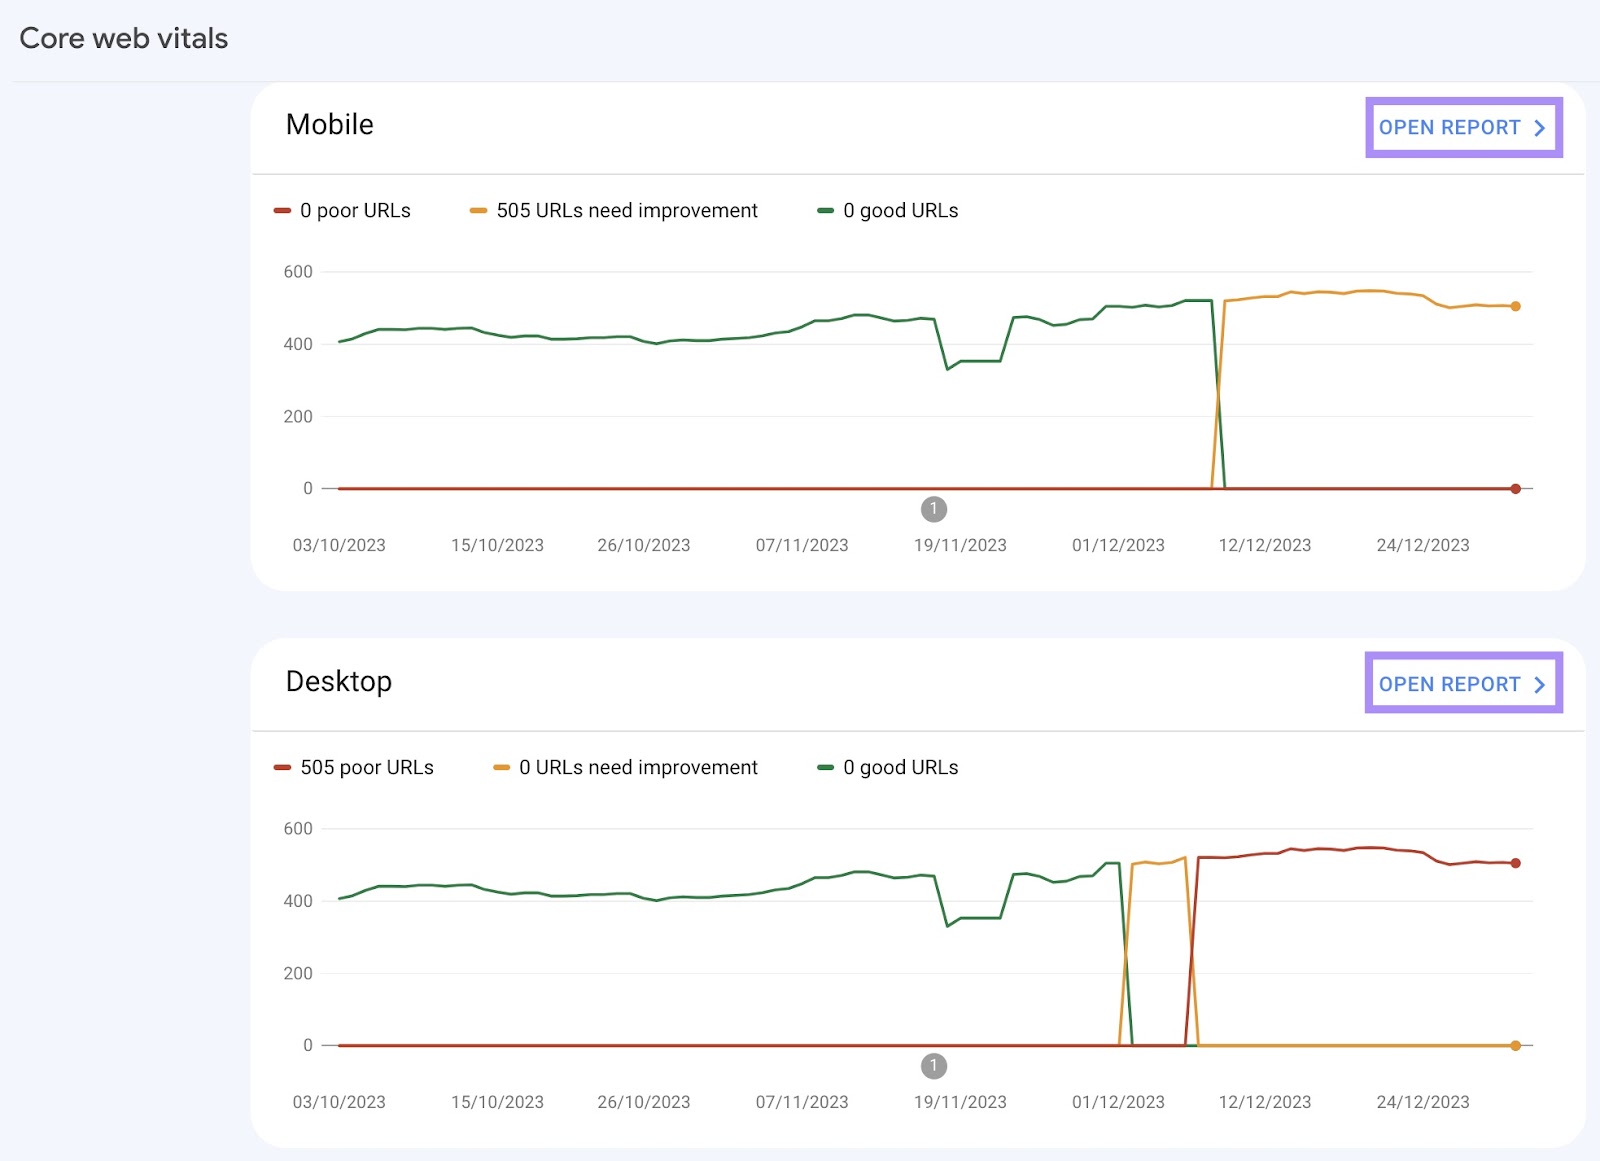
Here, you’ll see a high-level overview of how many URLs Google views as “Poor,” “Needs Improvement,” and “Good.”
The report is available for both mobile and desktop.
For a more detailed breakdown of your site’s performance, click “Open Report” in either chart.
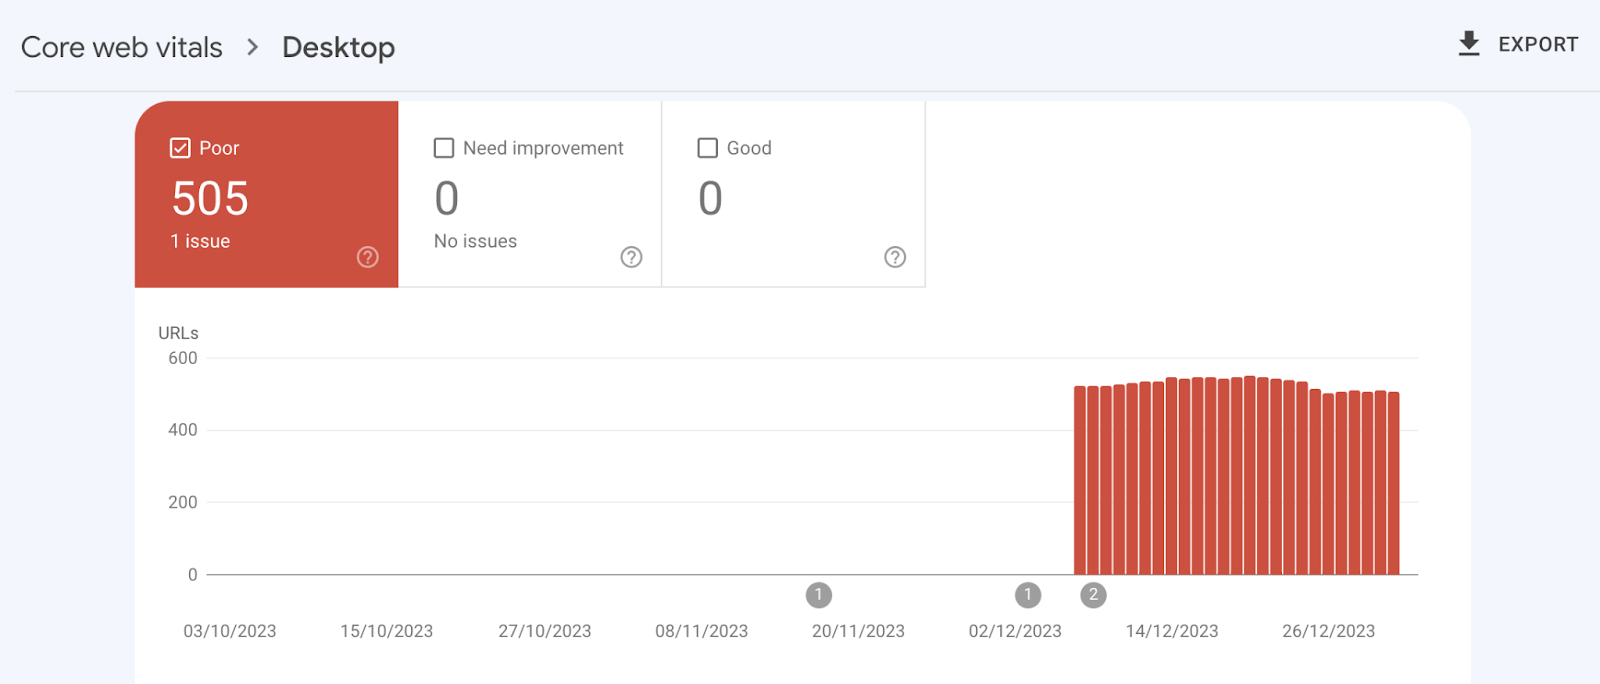
After opening the report, you’ll see a bar chart showing how many of your pages don’t meet the Core Web Vitals thresholds.
To see what issues exist and how many pages are affected for each, scroll down to the “Why URLs aren't considered good” panel.
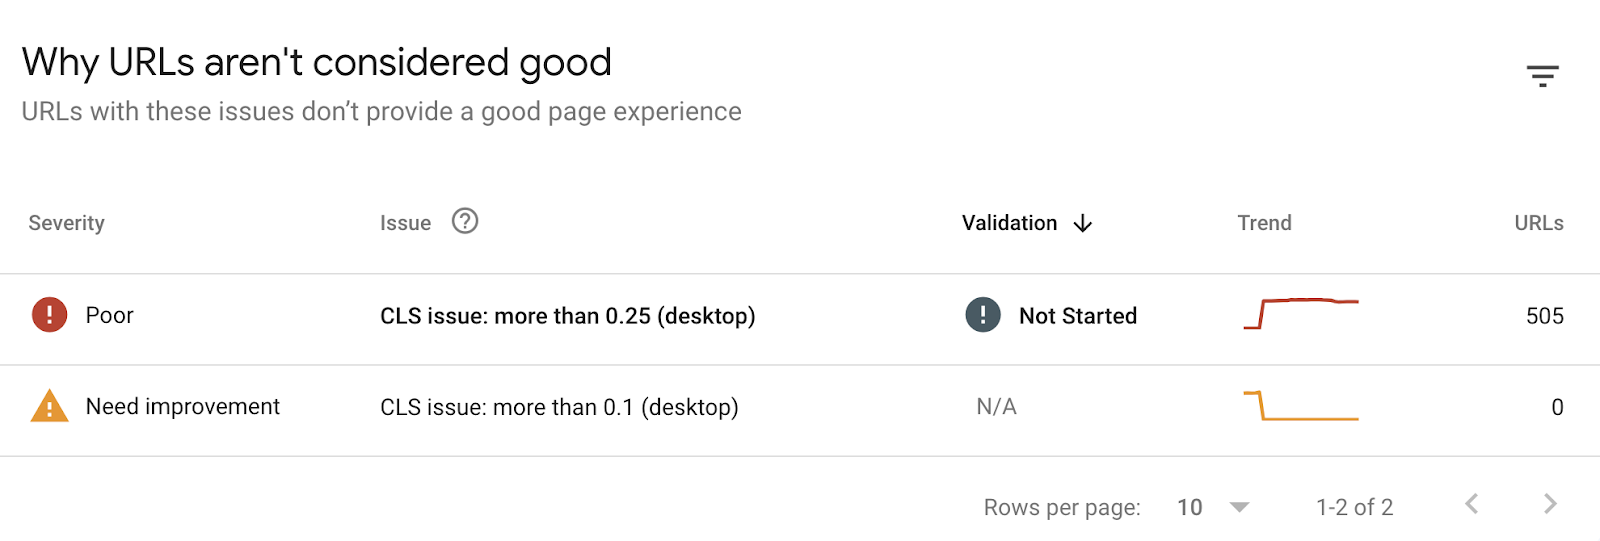
Click on an issue for more details.
Keep in mind that the Core Web Vitals report isn’t designed to help you figure out the status of a specific page. Instead, it lets you gauge the health of your site as a whole.
How to Improve Your Core Web Vitals Performance
Improving your Core Web Vitals scores doesn’t have to be daunting.
Let’s go over some steps you can take either on your own or with the help of a developer.
Improving LCP
Boosting your LCP can be done by making both small and large changes.
One of the easiest is optimizing your images by compressing them and using web-friendly image formats like WebP—which are up to 34% smaller in size than traditional formats.
You can also enable page caching. Which allows the page to be stored on the server after it’s loaded the first time. So it’s retrieved faster in the future.
Another way to improve your LCP score is to upgrade your web hosting.
Shared hosting (when multiple sites are hosted on the same server) can be slower because everyone shares resources like memory and processing power. So, your site can slow down when those other sites see traffic spikes.
To fix this, you might upgrade to a better hosting plan or a different type of hosting. Like dedicated hosting (when your site has its own server) or cloud hosting (when multiple servers are used to provide more reliable performance).
Improving CLS
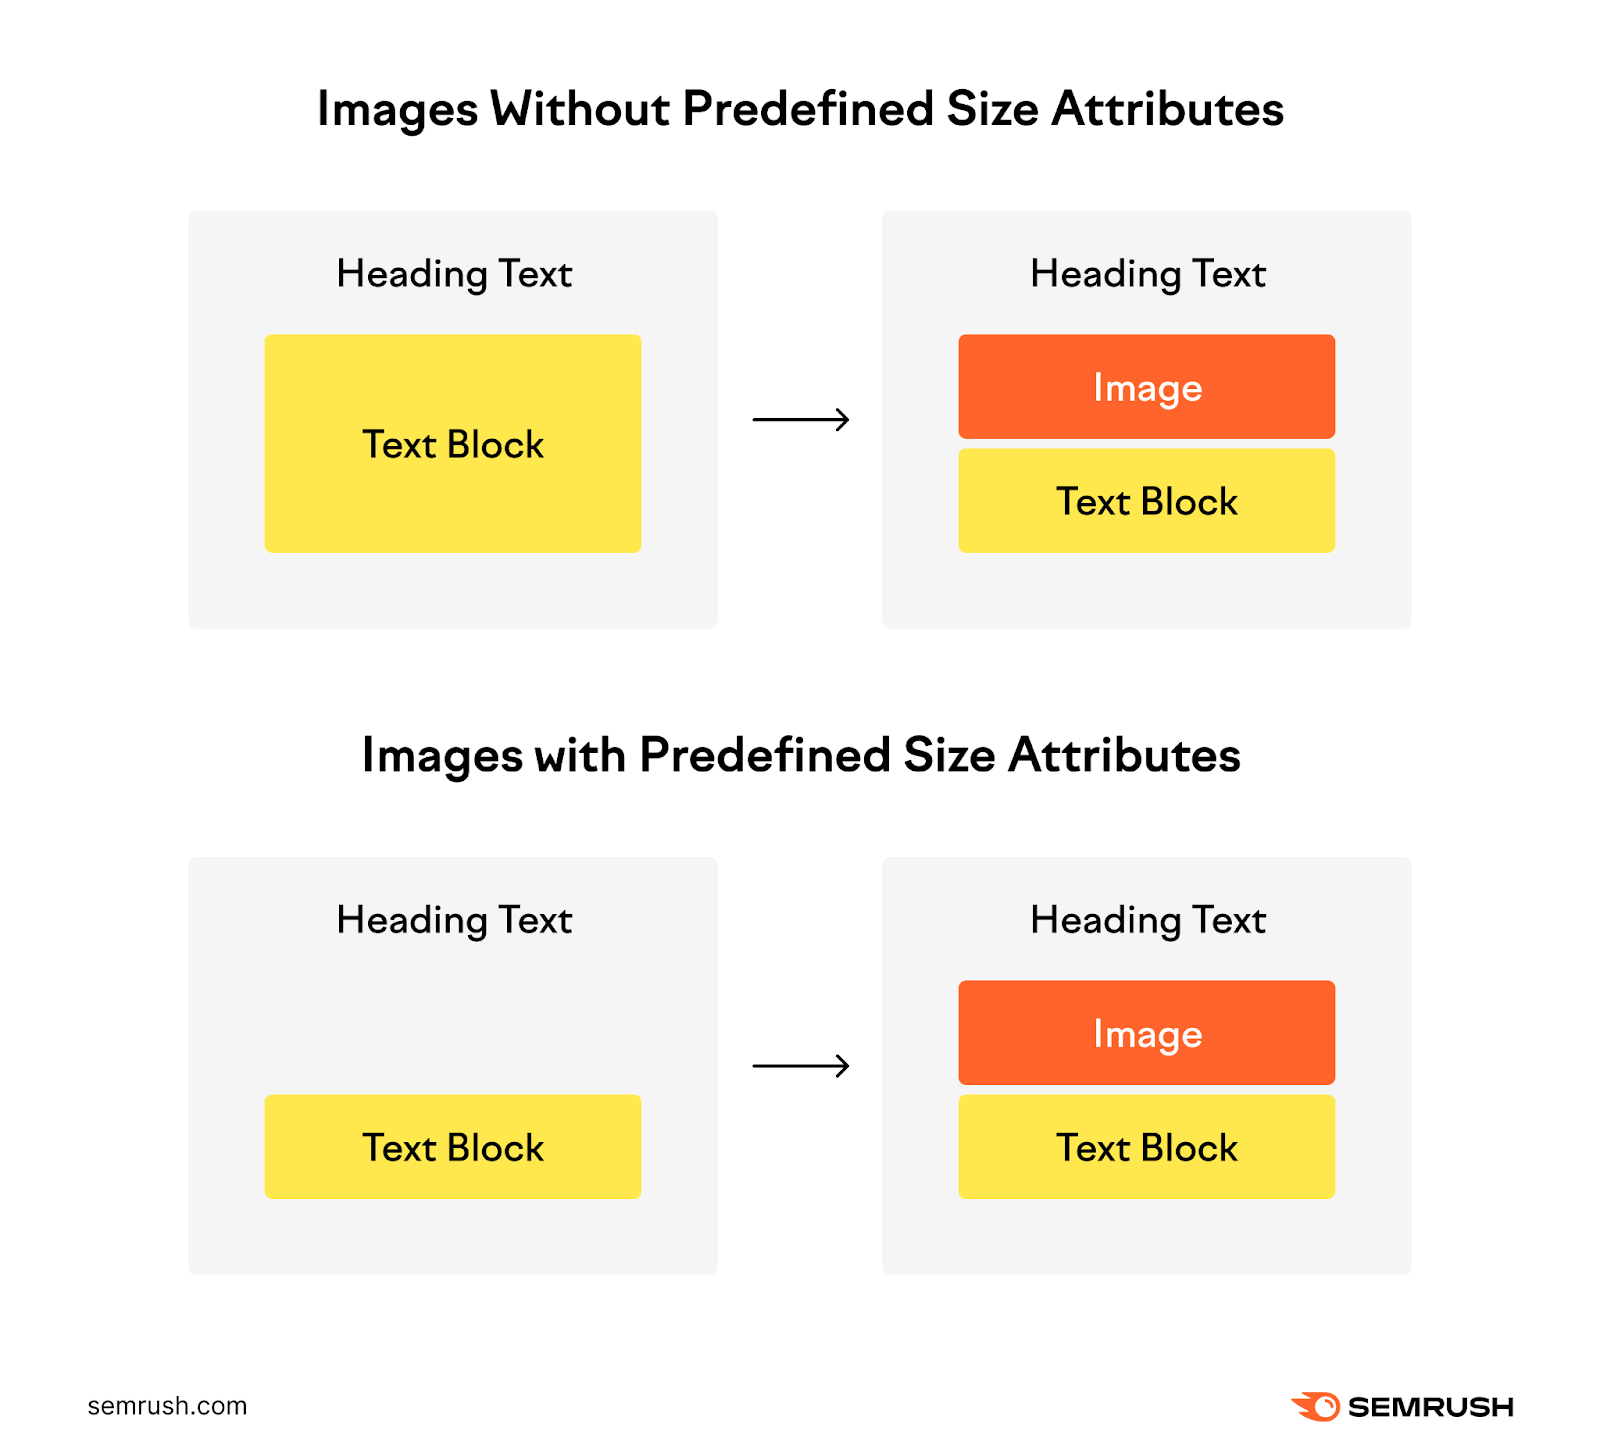
Issues with CLS tend to happen when elements like images, banners, or ads without dimensions push other content down or to the side as they load.
One of the most straightforward ways to improve your CLS score is by adding width and height size attributes to images and videos.
This way, the browser reserves the space for things like images or videos as the page loads. So everything fits neatly and doesn’t move around as people are viewing the site.
Alternatively, you can use aspect ratio boxes in your CSS code. This responsive design choice works by creating a container for your content that keeps the same width-to-height ratio across all screens.
The type of font you use can also impact your CLS score.
It’s best to avoid using web fonts since they need to be downloaded before the browser can display them. And stick with system fonts that exist on most devices like Arial, Helvetica, and Verdana.
If you do use web fonts for branding or design purposes, limit how many you use and the number of places where they appear.
For example, you could choose just one web font to use for headings and special sections.
Improving INP
One of the main factors that can hurt your Interaction to Next Paint is if your site has many large scripts or too much JavaScript code running.
JavaScript is a programming language used to make dynamic website features like
menus, forms, and animations. But extensive or complex JavaScript code can slow down how quickly your website responds to user actions.
Your developer can improve your INP by minimizing JavaScript and other non-essential code.
It’s also a good idea to break up long tasks the browser does behind the scenes that gets in the way of user interaction.
By breaking these tasks into shorter segments (which your developer can do through tactics like deferring code execution), the browser can handle user interactions more promptly.
You can identify a page’s long tasks using the Site Audit tool.
In your “Core Web Vitals” report, scroll down to “Analyzed Pages.” And click the drop-down caret next to a URL with a poor TBT score.
Scroll down to the TBT section of the report for a list of the longest tasks that are hindering your performance for that specific page.
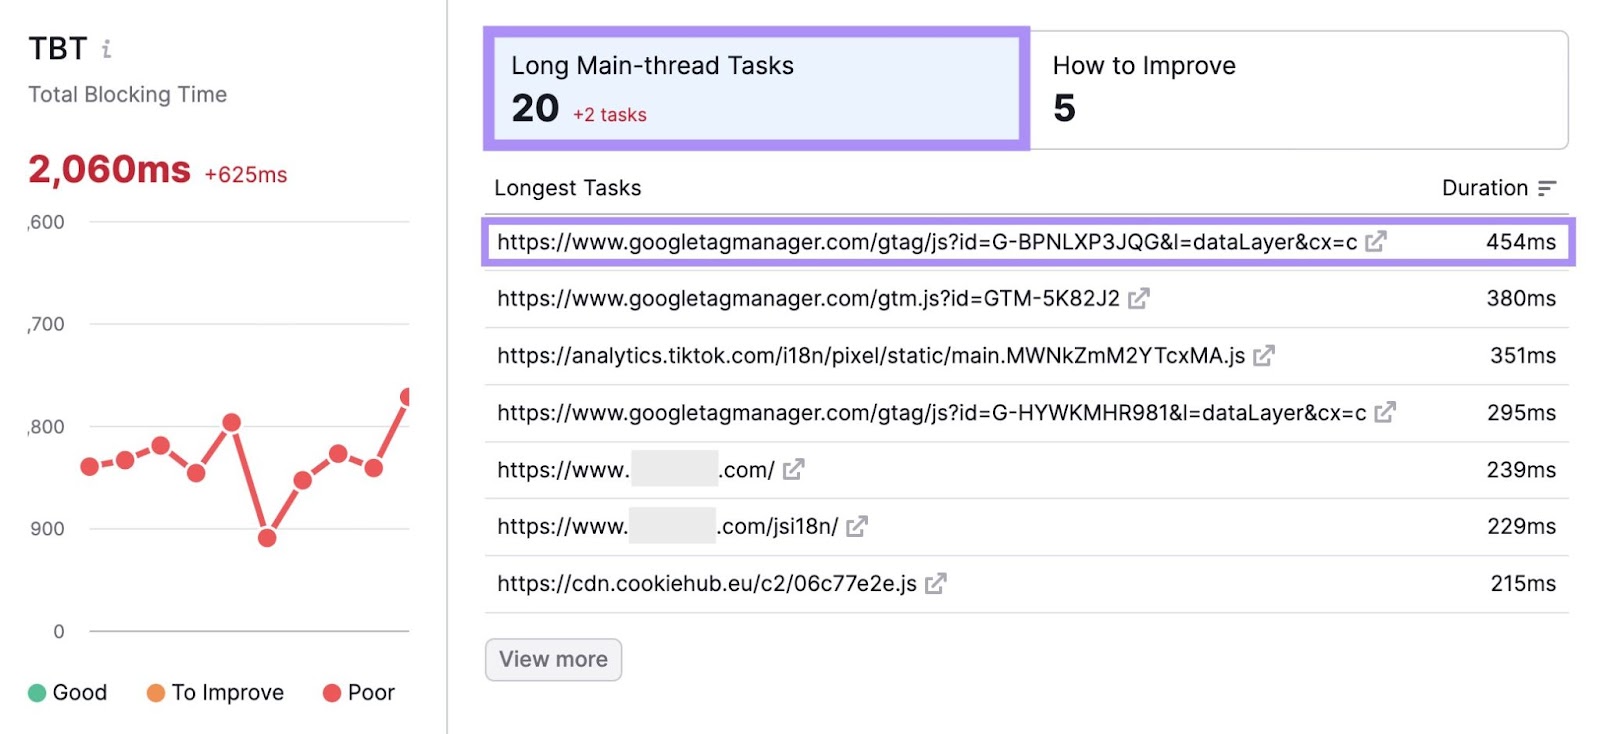
You can also get insights into specific fixes you can apply by clicking the “How to Improve” button.
Pass this information along to your developer so they can start improving your INP performance.
Further reading: Core Web Vitals Most Common Issues and How to Overcome Them
Tips for Prioritizing Core Web Vitals Fixes
The key to successfully addressing any Core Web Vitals issues is prioritizing them. So you can gradually improve your site’s performance without getting overwhelmed.
Here are some suggestions to use as you determine your next steps:
- Consider the ease of implementation: Sometimes, one issue may be quicker to fix than another. For example, optimizing images to improve LCP might be more straightforward than adjusting complex layouts to improve CLS.
- Remember your website’s purpose: If you have a content-heavy site like a blog or news publication, improving LCP first might be more impactful because your users are going to value fast-loading content the most. But if you have an ecommerce site that relies heavily on user interaction, then prioritizing CLS first likely makes more sense.
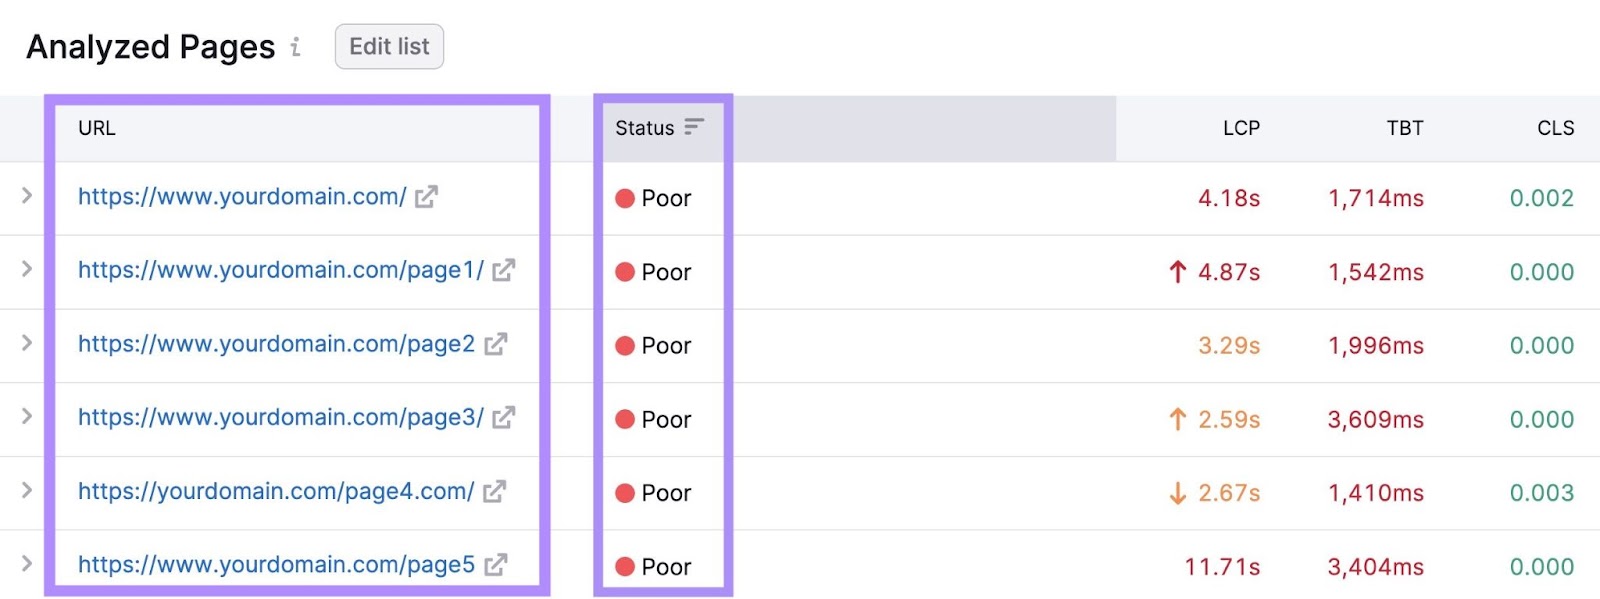
- Look at the data: If some pages are significantly worse than the others, you might want to start with those. You can use Site Audit to help. In the “Core Web Vitals” report, scroll down to the “Analyzed Pages” section to see a list of URLs with “Poor” and “To Improve” statuses.
Boost Your Site’s User Experience
Your site’s Core Web Vitals performance plays a large role in how users experience your site.
Good scores can contribute to lower bounce rates, better engagement, and even higher conversions. Not to mention better search rankings.
And there are tools available to guide you in the right direction.
Like Site Audit. Which provides insights into much more than just your Core Web Vitals metrics.