
Google Analytics 4 (GA4) lets you track your content performance. To uncover data you can use to improve your website.
In this guide you’ll learn how to use Google Analytics for SEO. So you can get better results from your SEO efforts.
But first, you need to do a bit of preliminary work.
Set Up Your GA4 Account to Collect the Right Data
The first step is making sure you’re collecting the right data. With enhanced measurement events and Google Search Console (GSC).
Start Using Enhanced Measurement Events
Google Analytics records visitor data as “events.” And enhanced measurement events are a type in Google Analytics 4 that provides more comprehensive SEO data.
They do this by recording visitor activity like external link clicks, scrolls, and site searches.
Here’s how you can make sure you’re collecting this enhanced data:
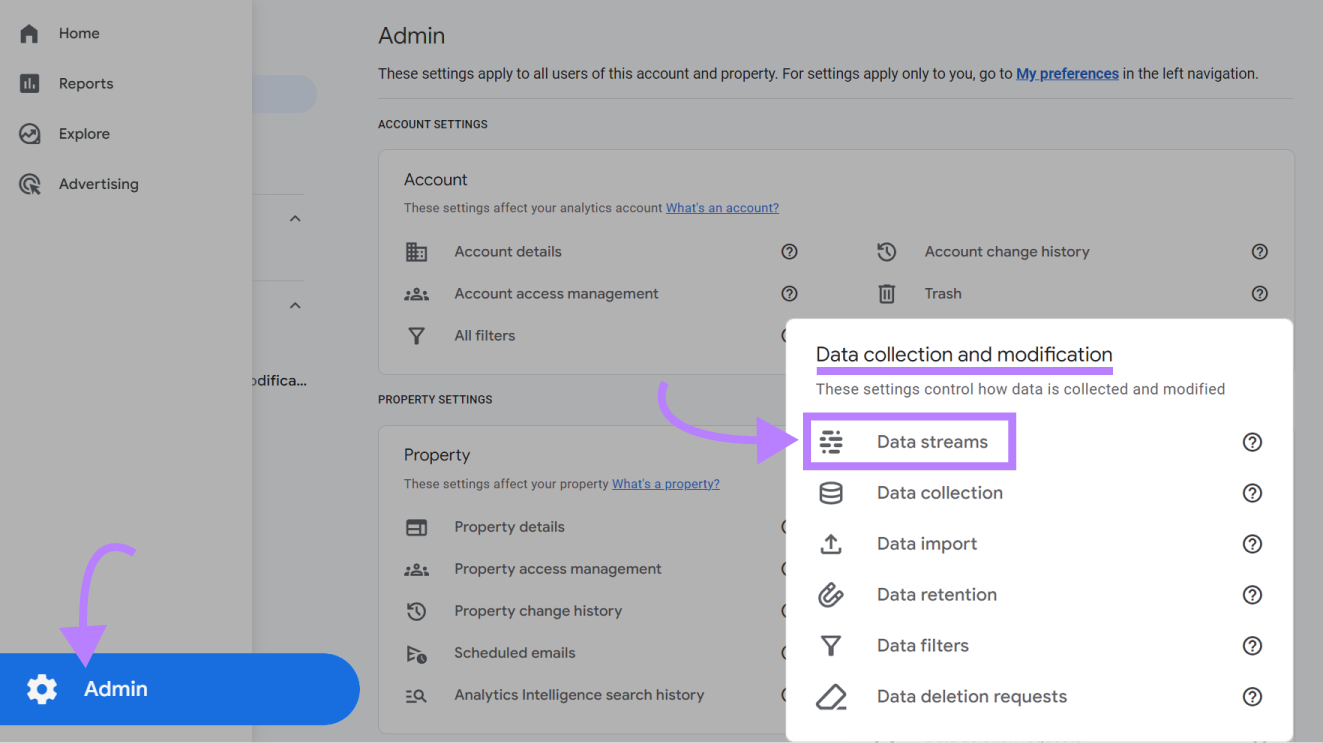
First, click on the gear icon in the bottom left of the screen to access the “Admin” section. Then, click on “Data streams” under “Data collection and modification.”
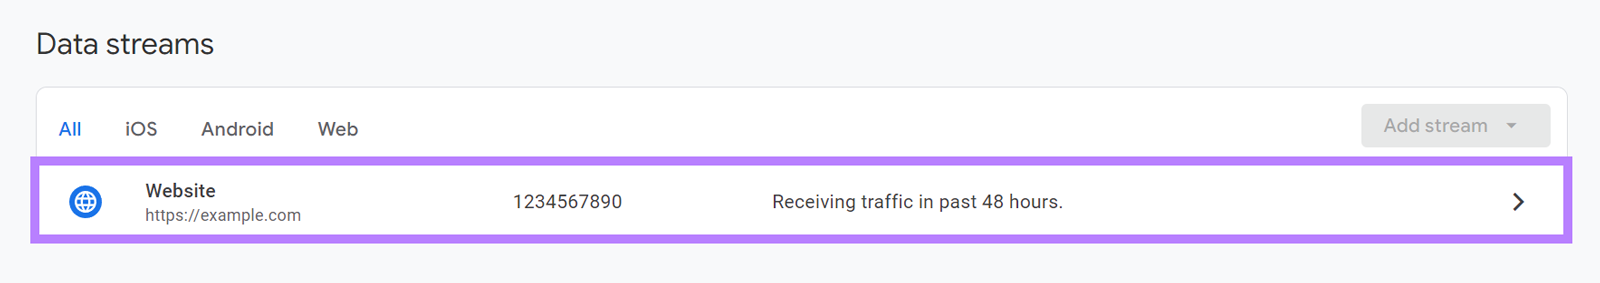
And click on the data stream for your website.
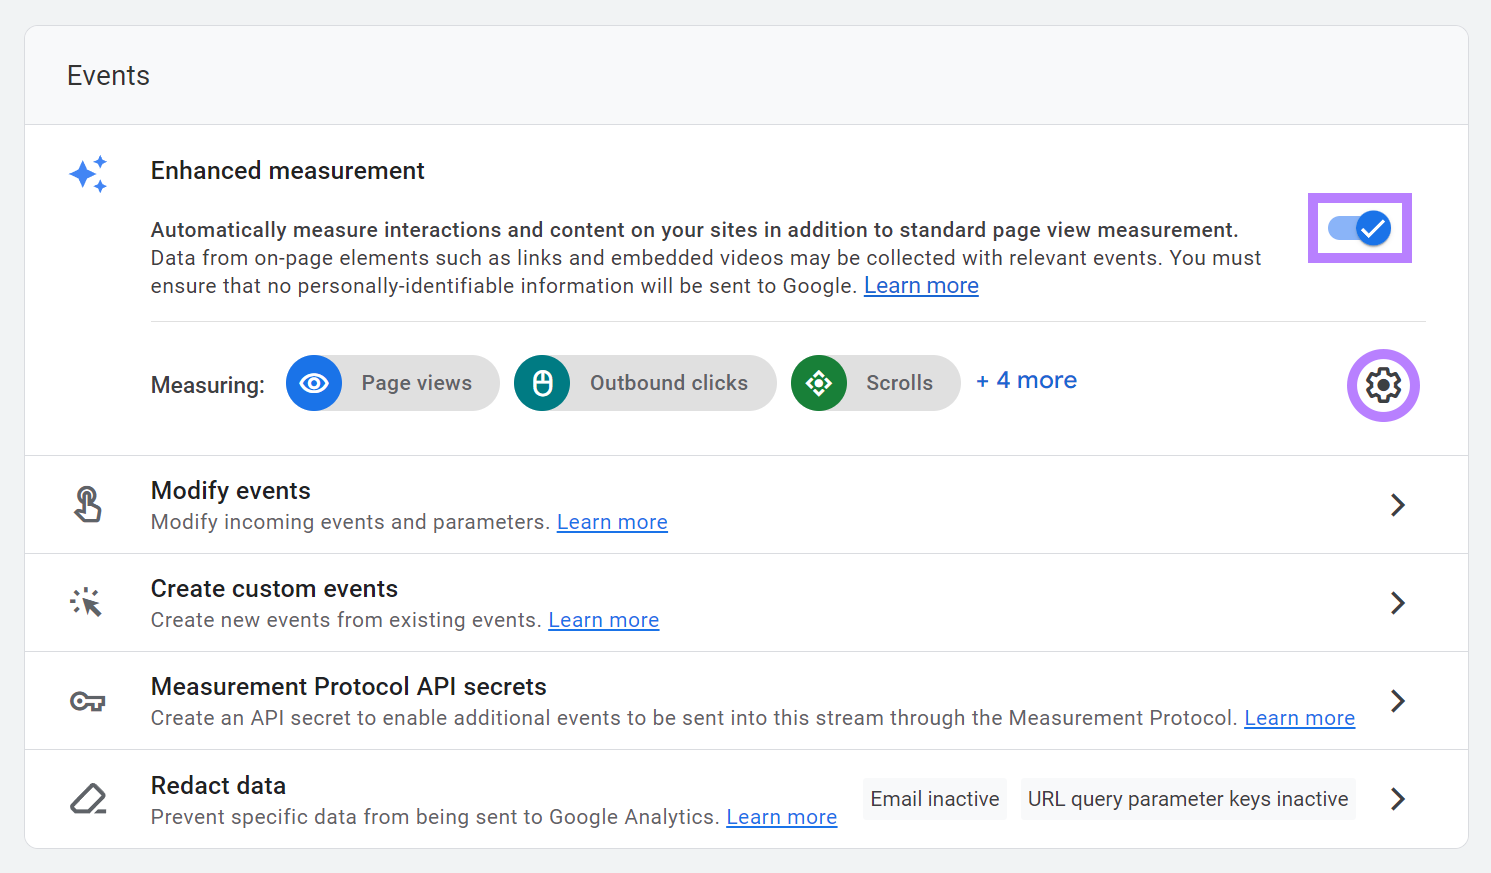
In the “Events” settings, click the toggle beside “Enhanced measurement” to turn it on. Then, click on the gear to review your individual settings.
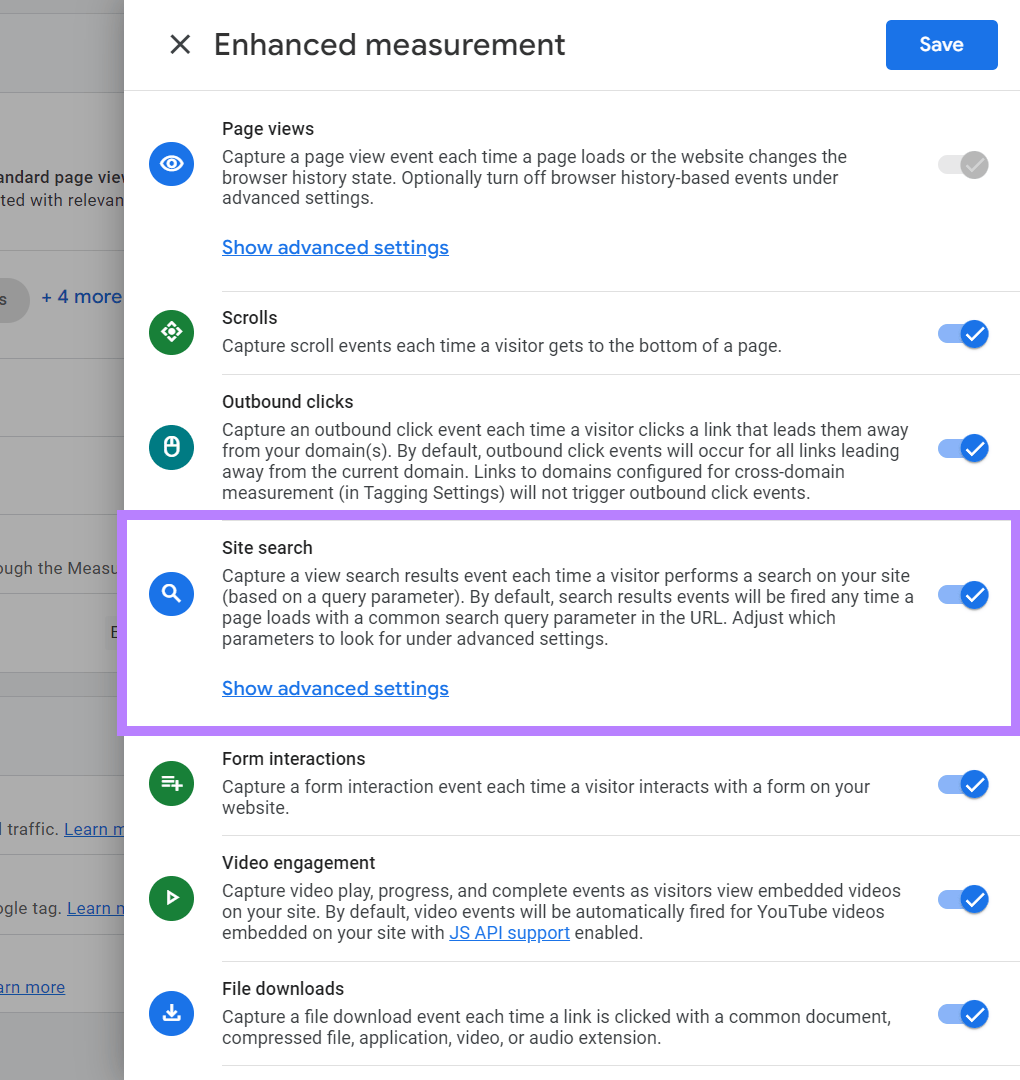
Make sure that “Site search” is toggled on. We’ll use site search data to gather SEO insights later.
Further reading: Google Analytics 4 Events Guide
Connect Your Google Search Console Account
Connecting GSC to Google Analytics lets you see which search queries drive visitors to your website. And view your site’s top-ranking landing pages.
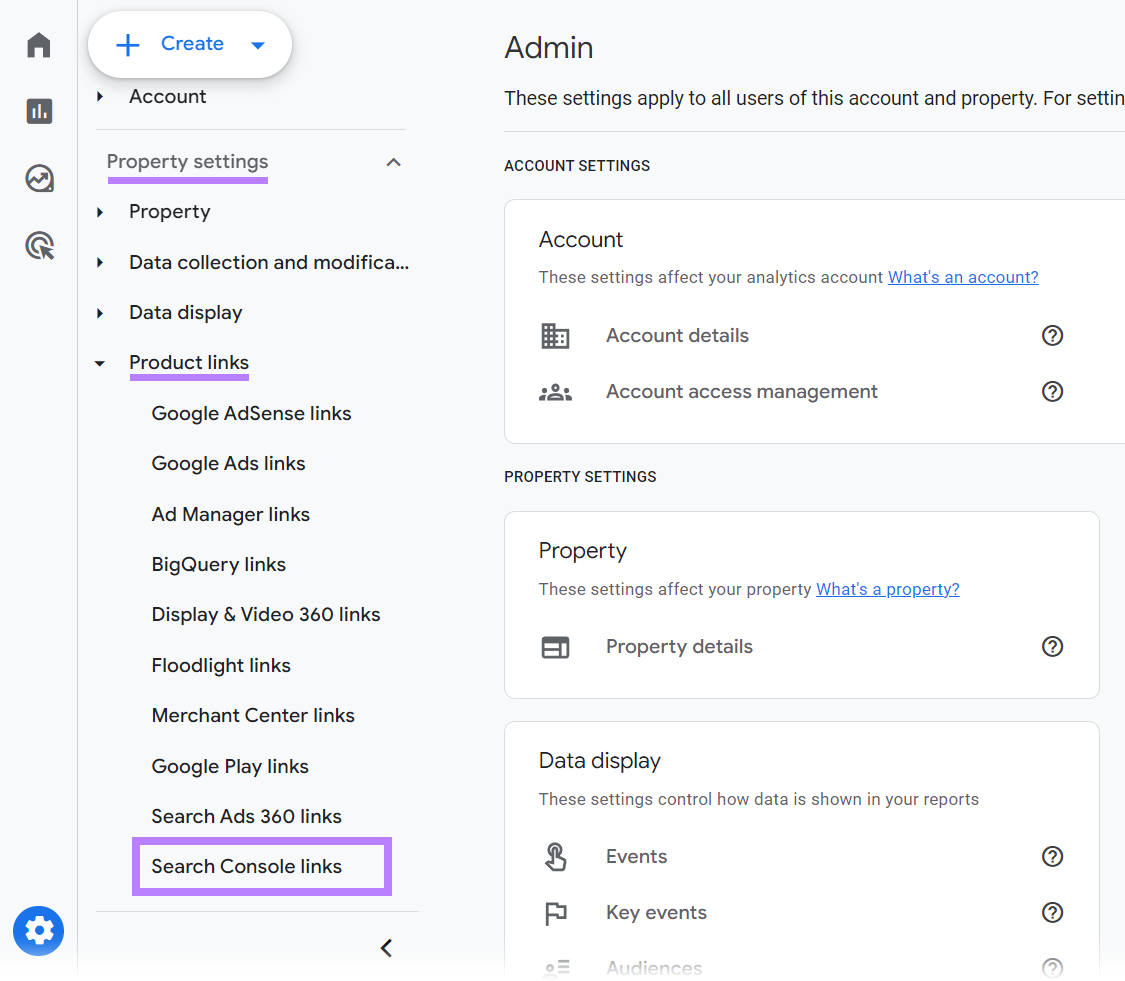
To connect GSC to GA4, click the gear icon to go to the “Admin” section.
Then, click on “Property settings” > “Product links” > “Search Console links.”
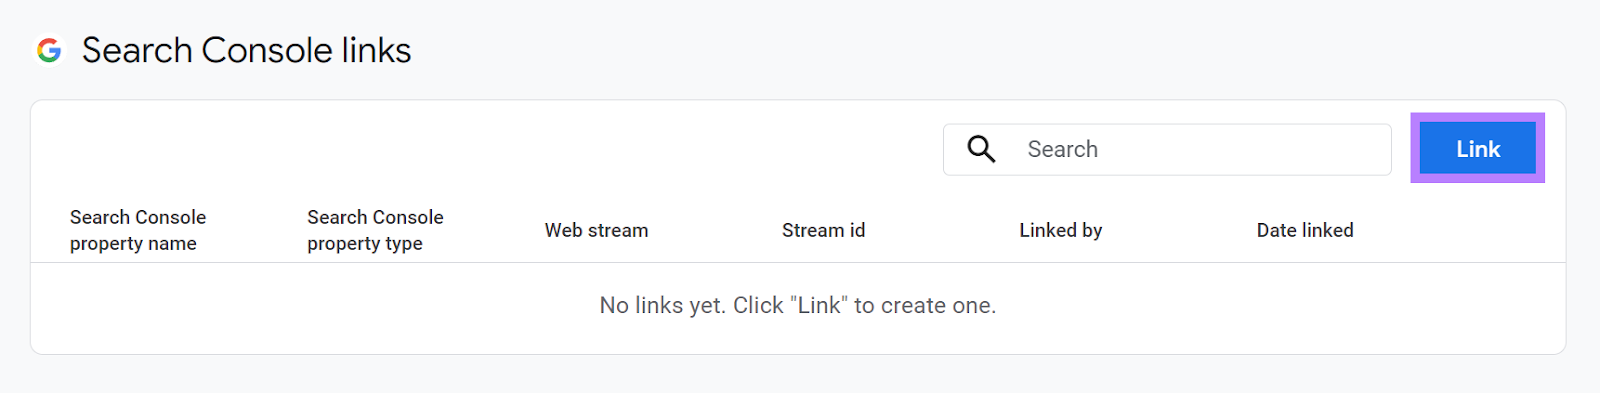
Click the “Link” button.
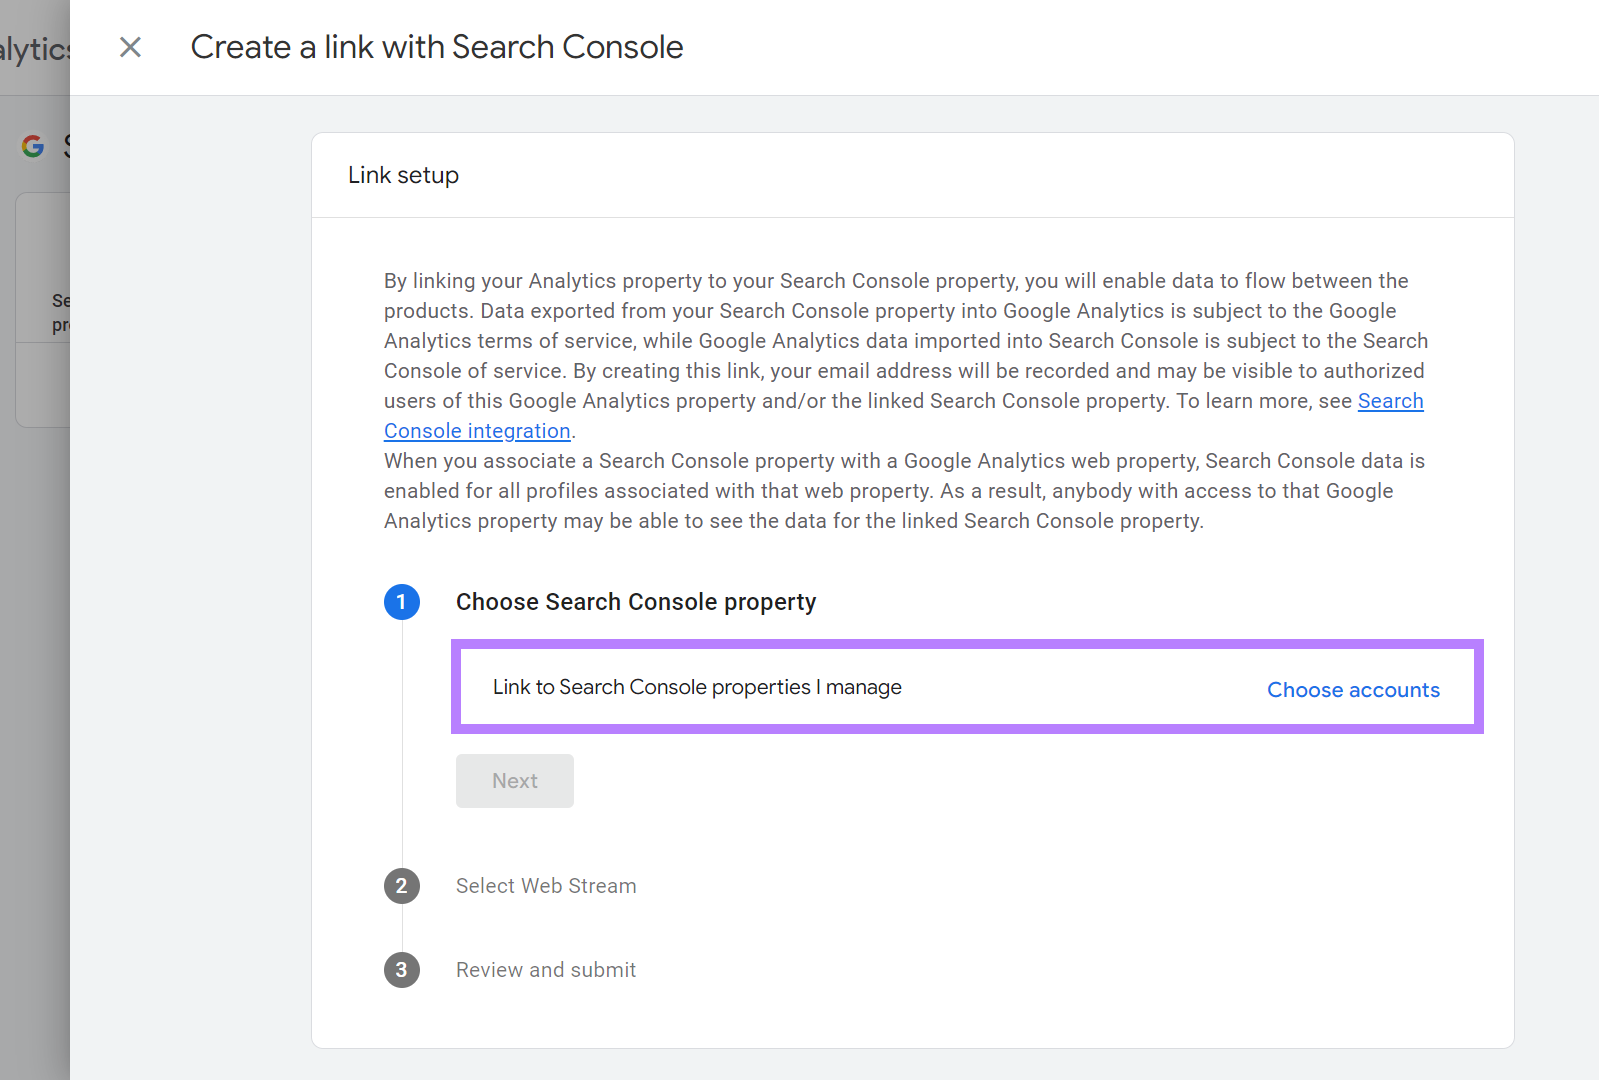
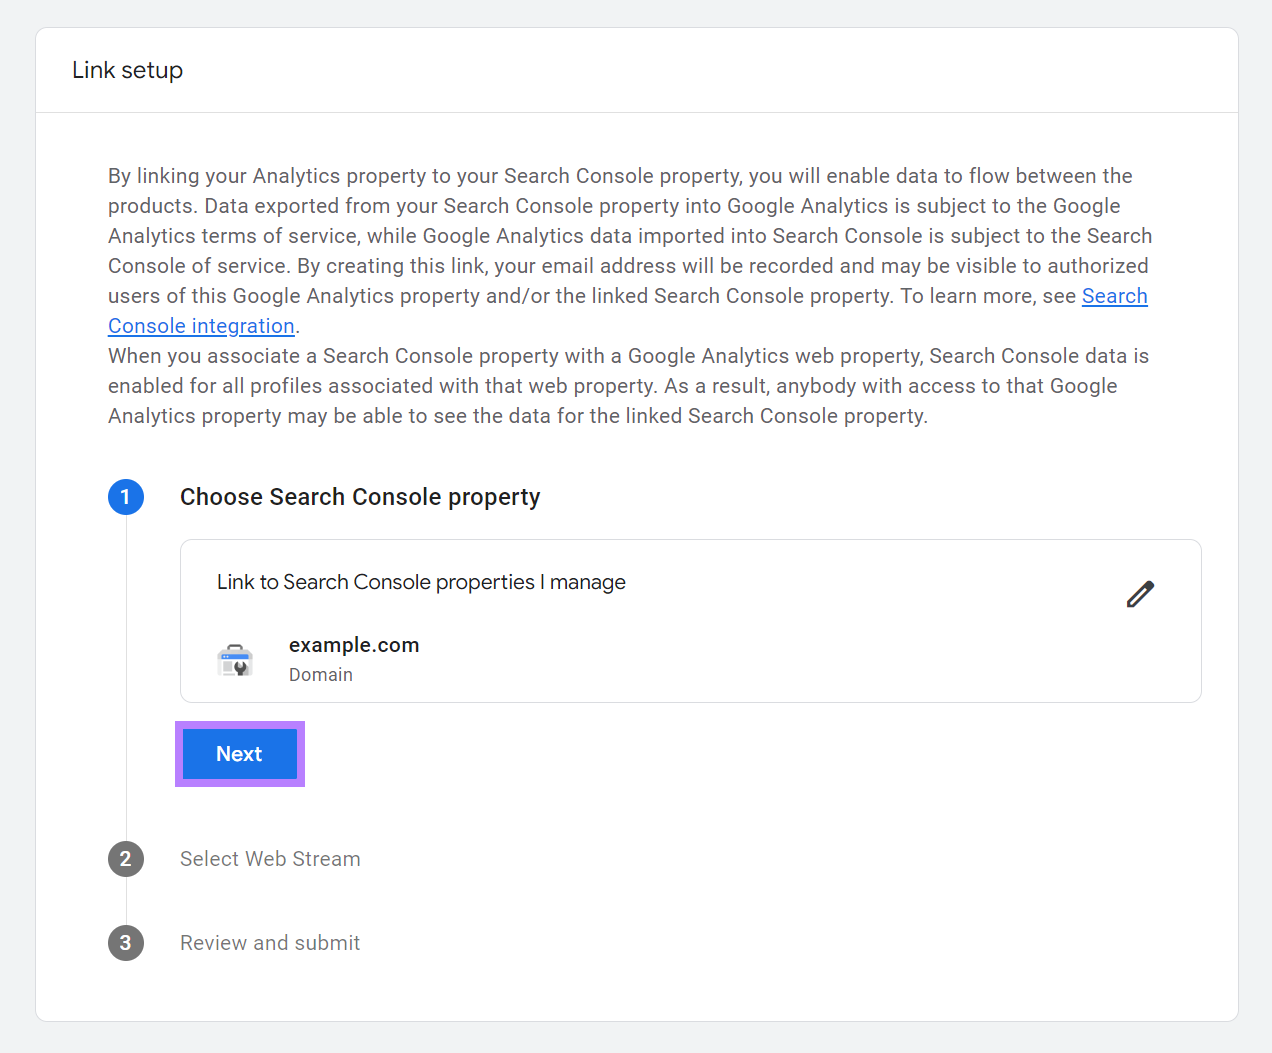
And then click “Choose accounts” to select your Search Console property.
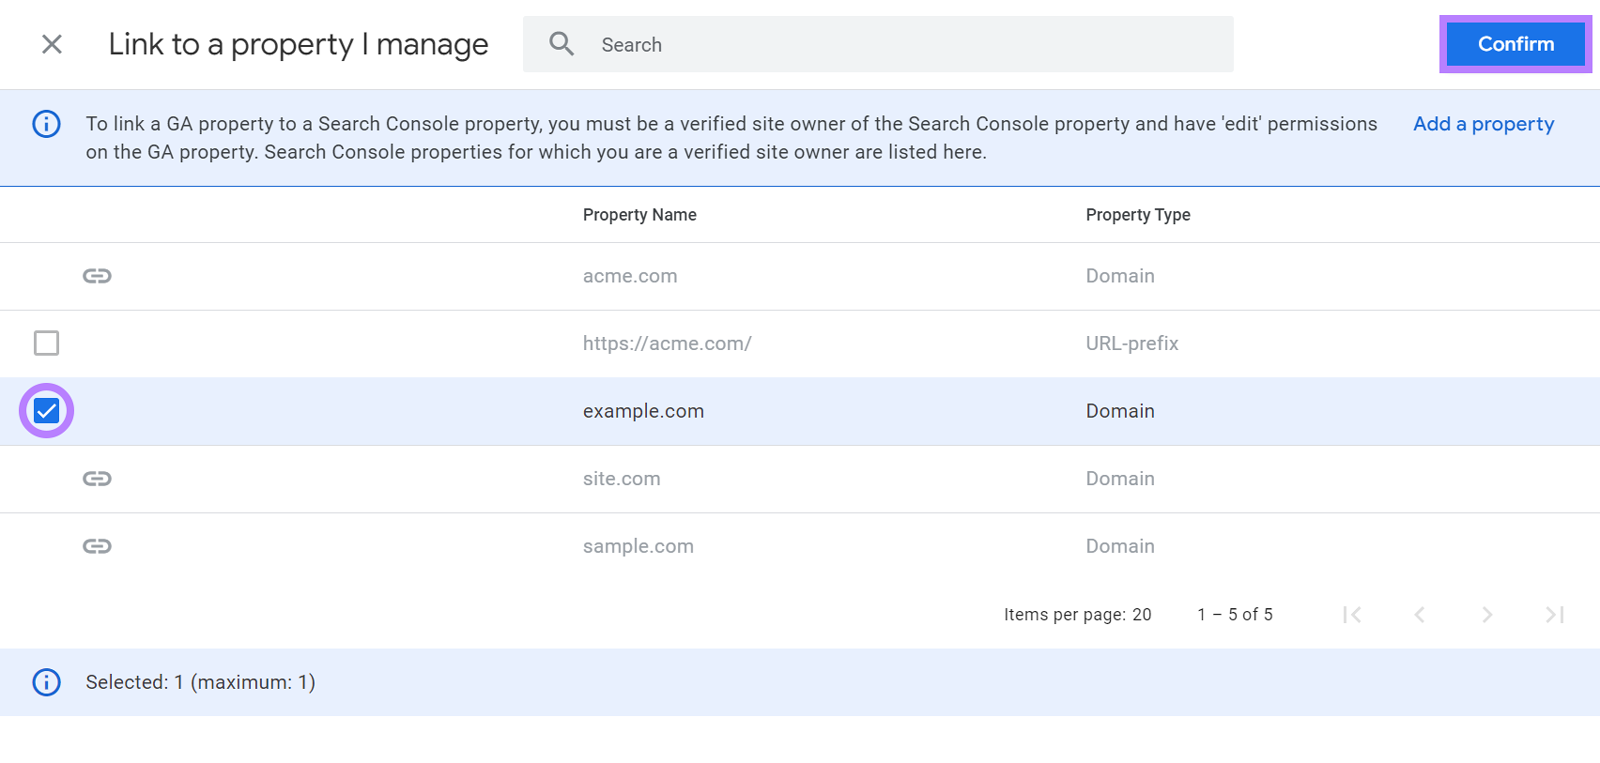
You’ll see a list of Search Console properties that you’re a verified owner for.
Choose the correct property using the checkbox. Then click “Confirm.”
Click “Next” to pair your property with your GA4 web data stream.
Click “Select” next to Web Streams.
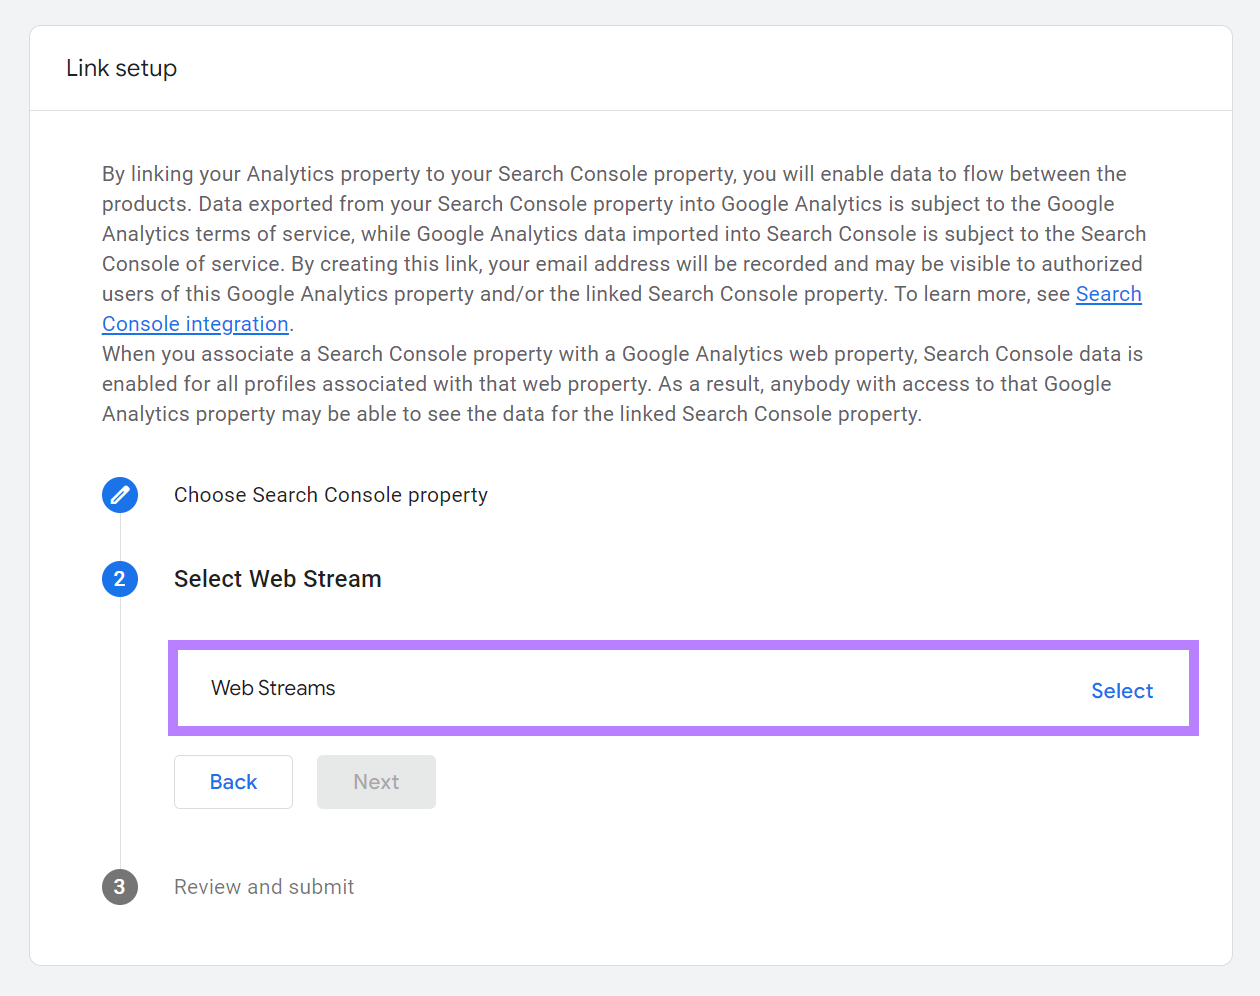
You’ll see the web data stream for your GA4 property. Select your data stream and then click “Next” once again.
And finally, click “Submit.”
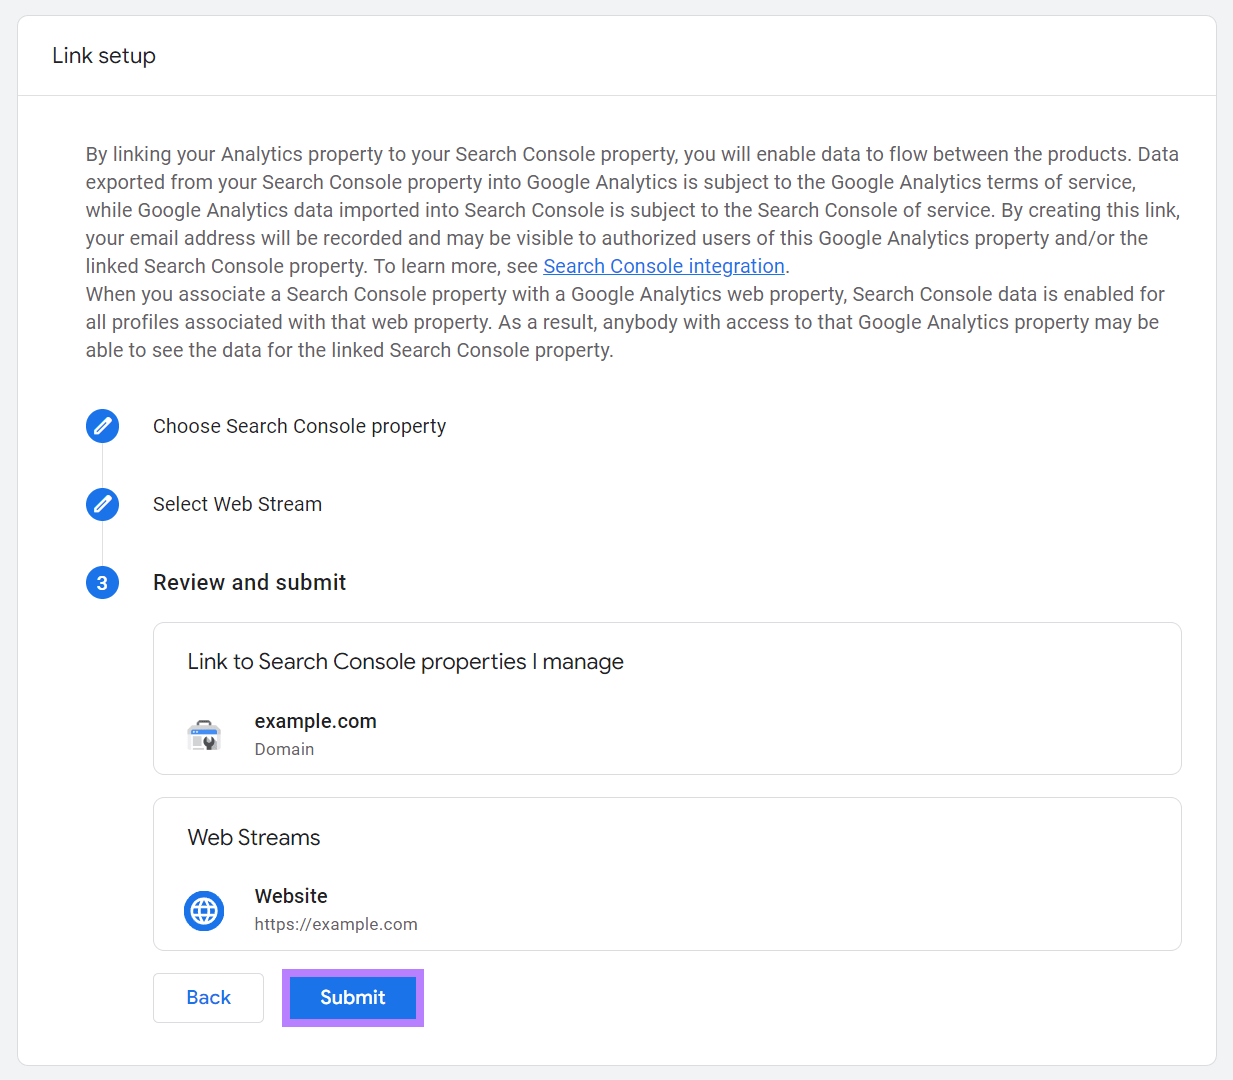
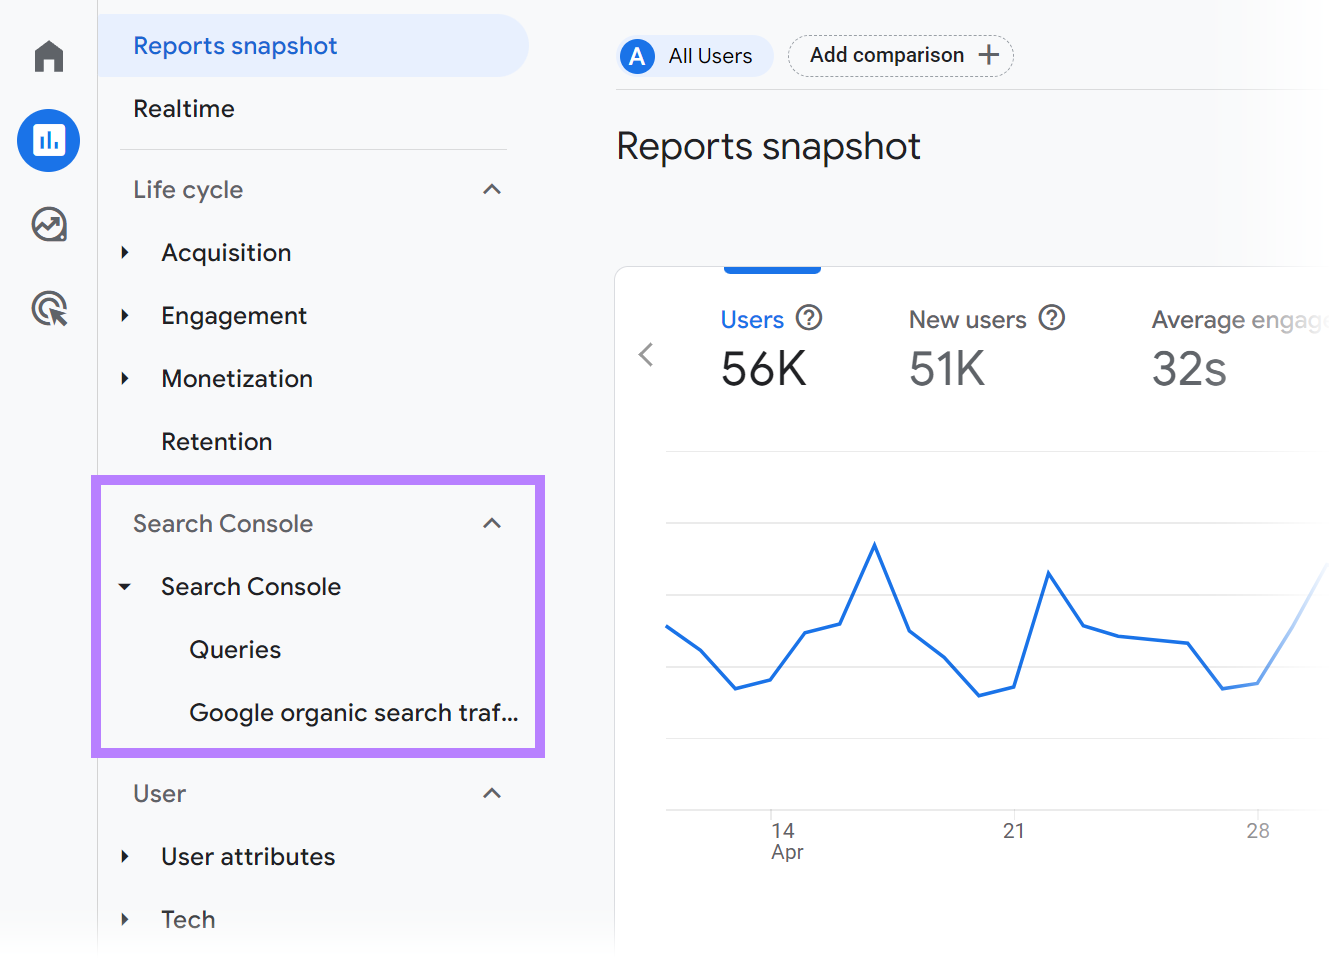
You’ll now have access to two new reports related to GSC. So, you’re ready to use Google Analytics for SEO.
6 Best Practices to Using Google Analytics for SEO
1. Discover Keywords Visitors Search For on Your Site
Most websites have search functionality. Like this:
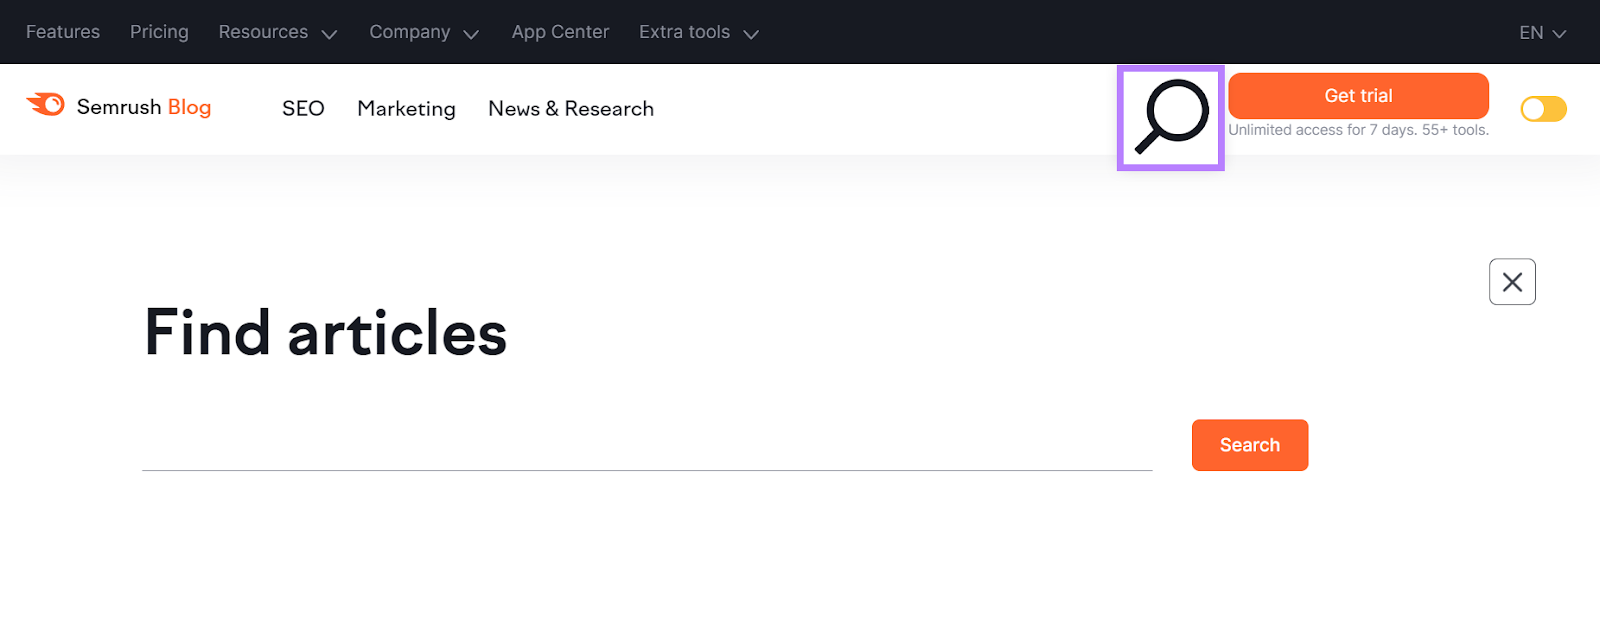
Google Analytics can track what your website visitors are typing into that search bar. So you can optimize or create content to more directly address those queries.
To use Google Analytics for SEO content ideas like this, you need to modify an existing report.
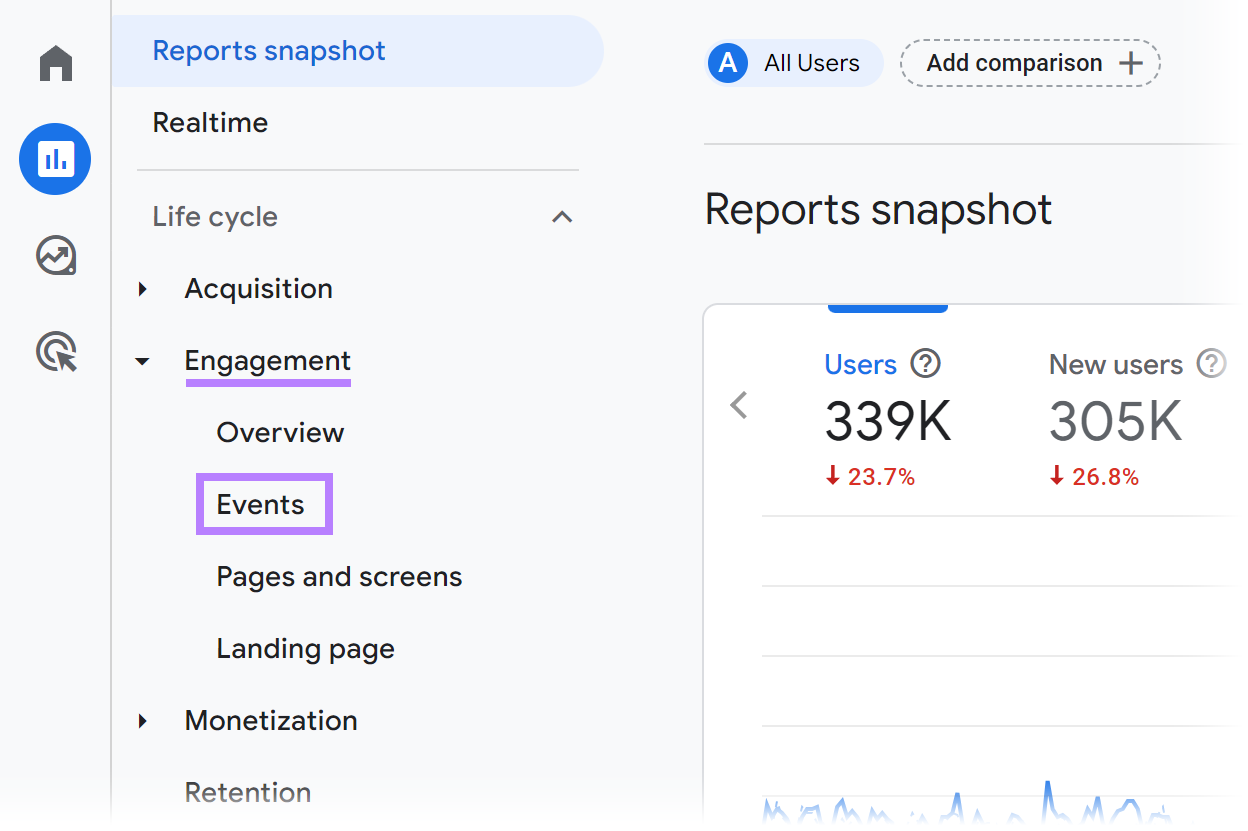
Go to “Reports” > “Engagement” > “Events” within the left-hand navigation.
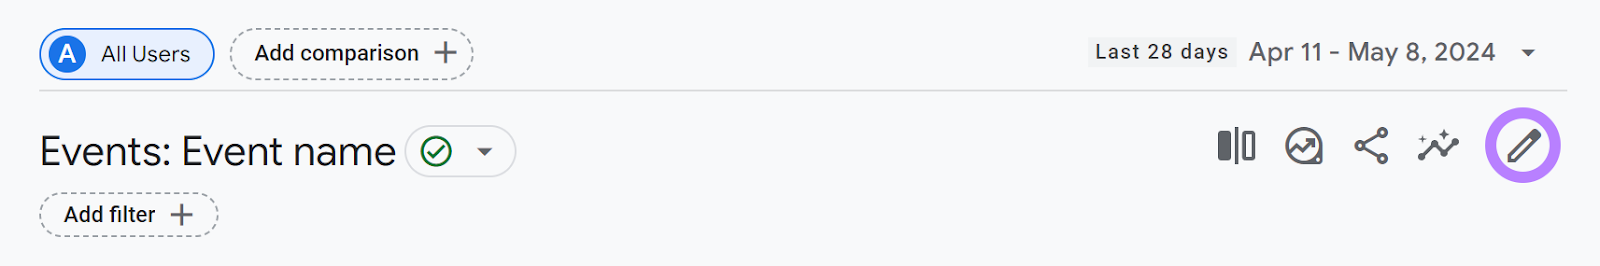
Click the pencil icon at the top right to customize the report.
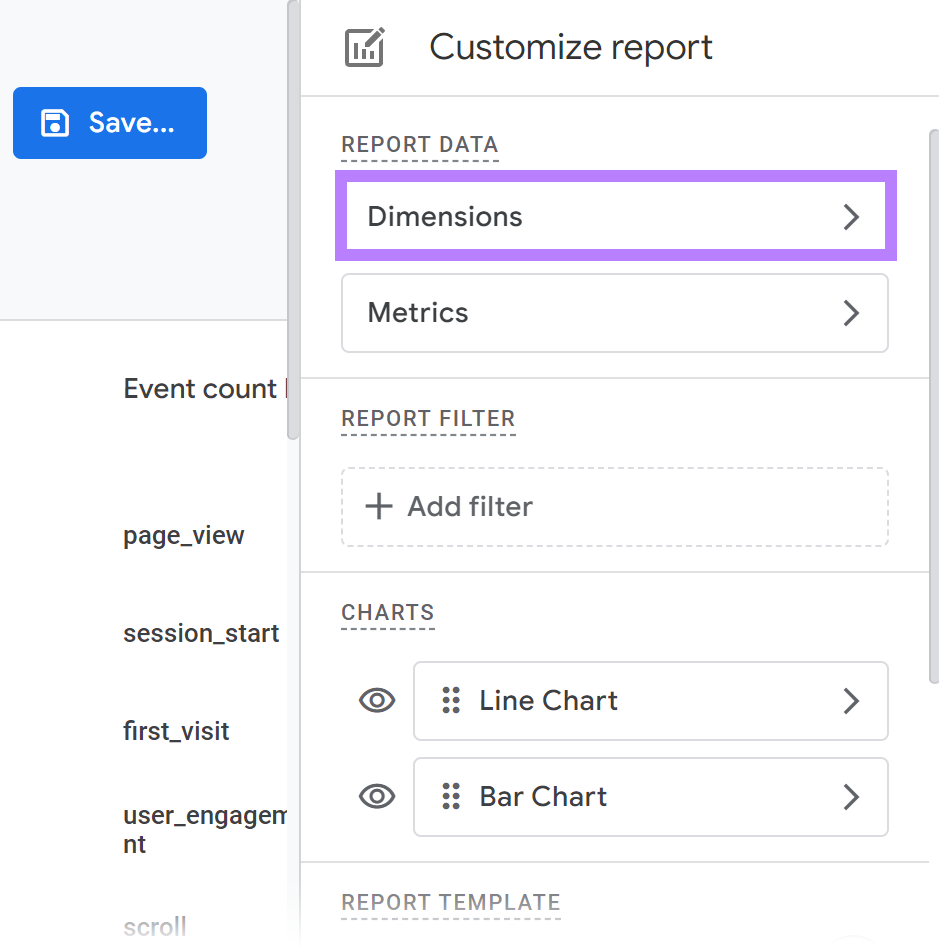
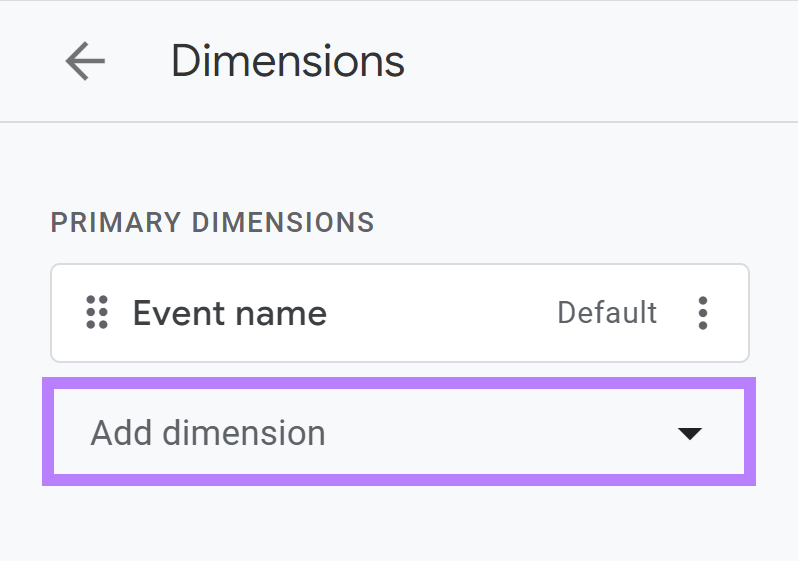
Then, click “Dimensions.”
Click “Add dimension” to open a search bar.
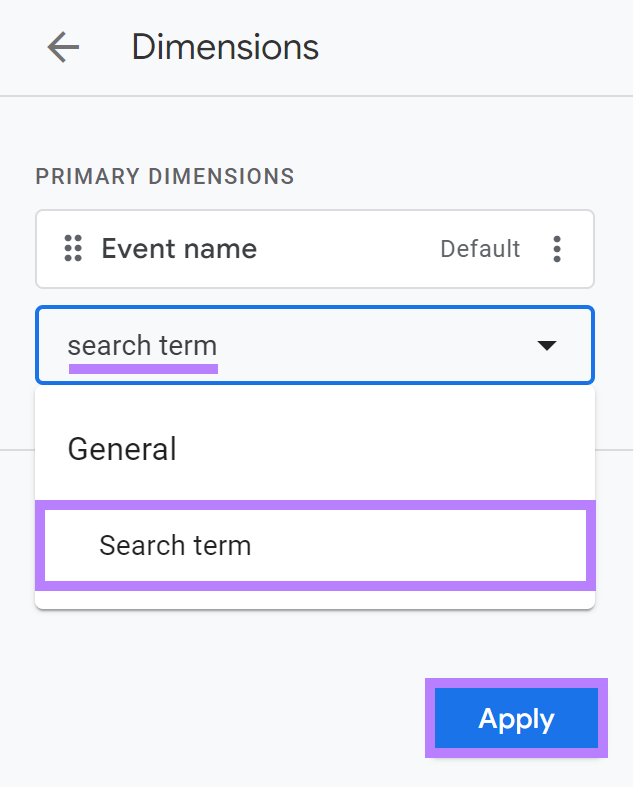
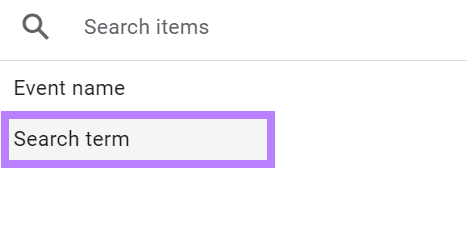
Begin typing “search term” in the search field. And click on “Search term” when it appears as an option.
Then click “Apply.”
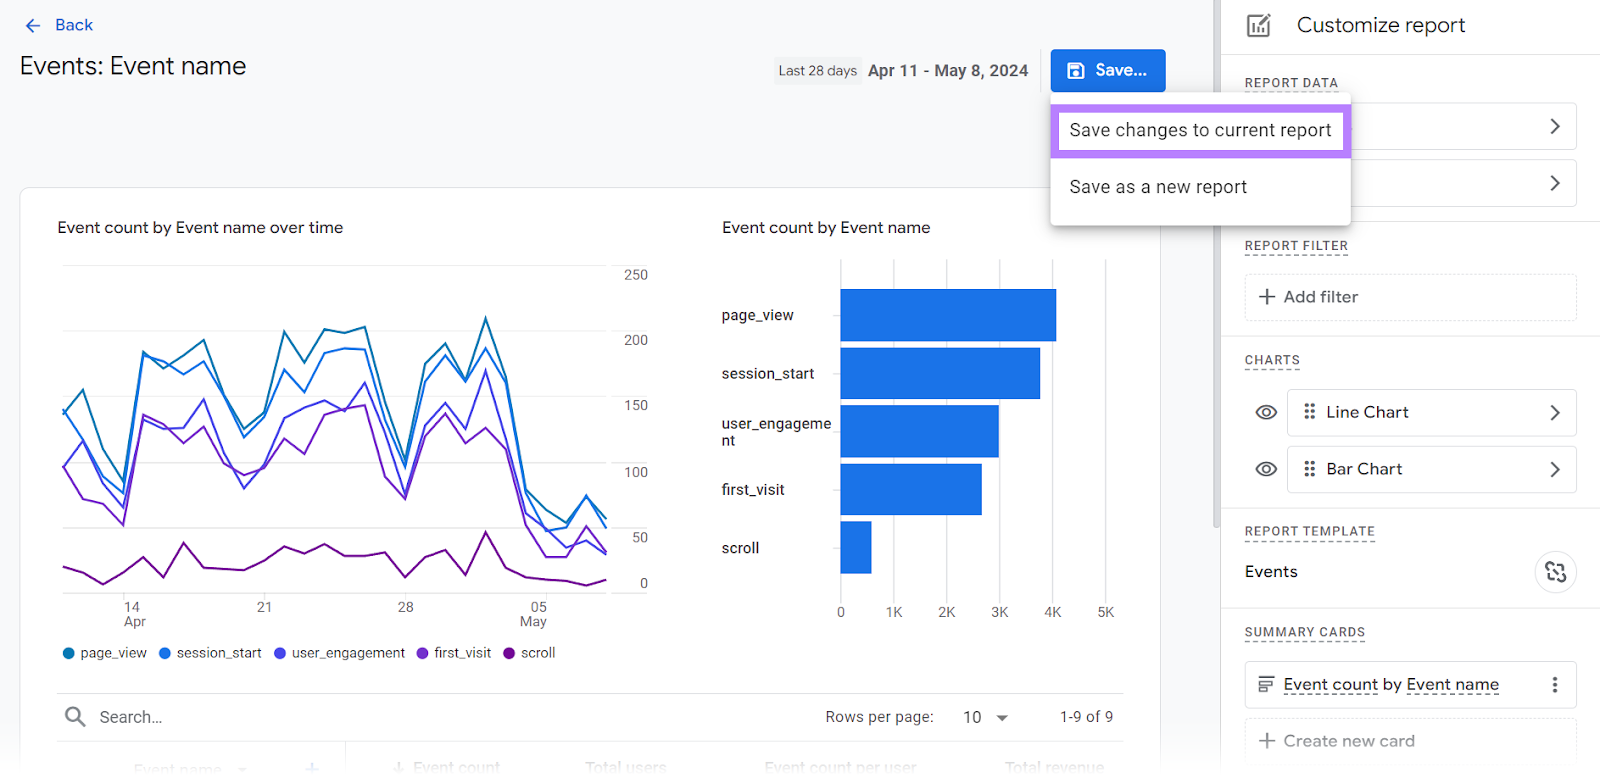
Now, save your customized report by clicking “Save” > “Save changes to current report.”
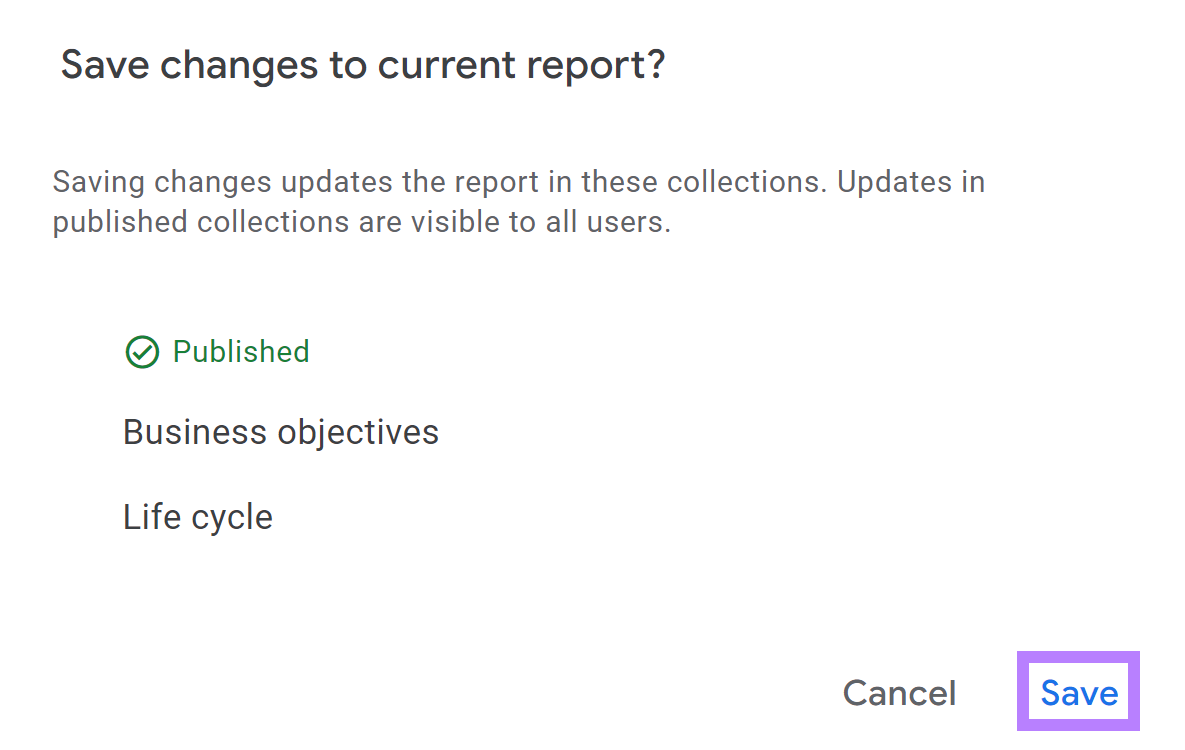
And click “Save” one final time to confirm.
Your search term data is now available in the customized report.
To see it, click the drop-down arrow to the right of the “Event name” column header.
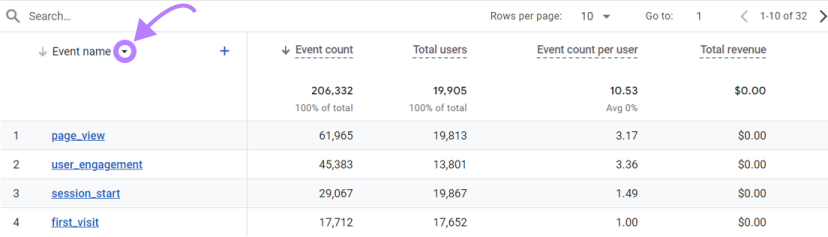
You’ll see the option to change the dimension.
Click “Search term” and the report will refresh to include that site search information.
You can now see what people search for on your site.
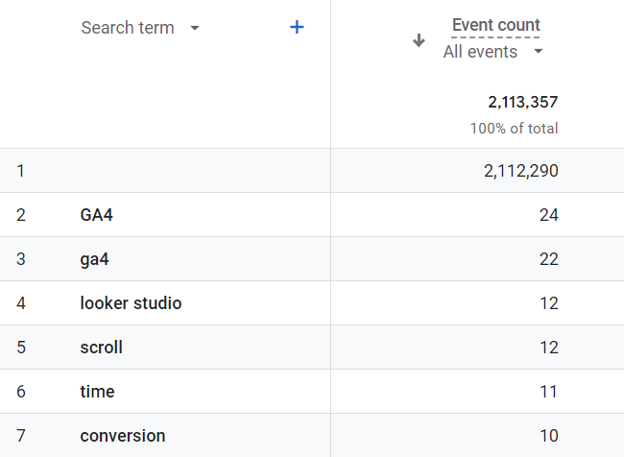
You now have a list of keywords your visitors actually use on your site.
Let’s take it a step further and look into those search terms. To see whether they’re viable content ideas.
Let’s say GA4 shows you that your visitors are searching your site for “looker studio." But you don't have any content on the subject.
You might decide to begin writing about Looker Studio since it's interesting to your visitors.
But what specific topics within that theme have the best keyword potential?
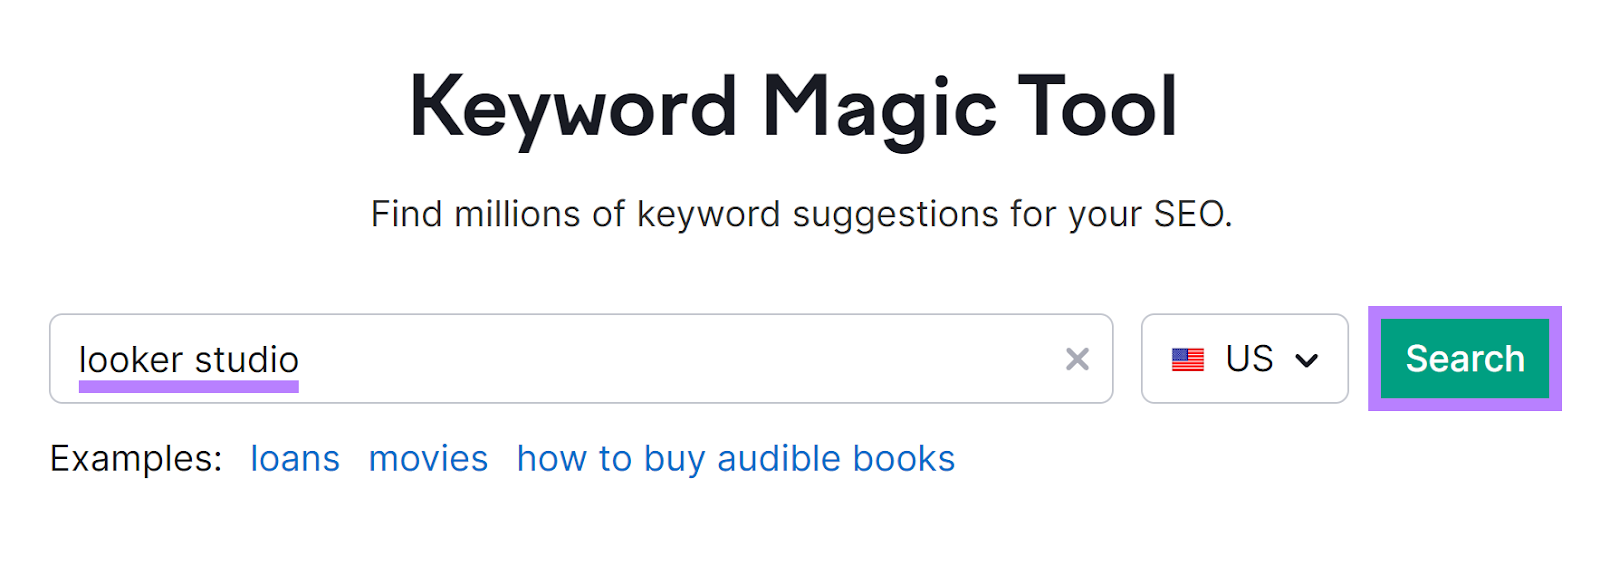
You can find relevant topic ideas in just a couple of clicks with the Keyword Magic Tool.
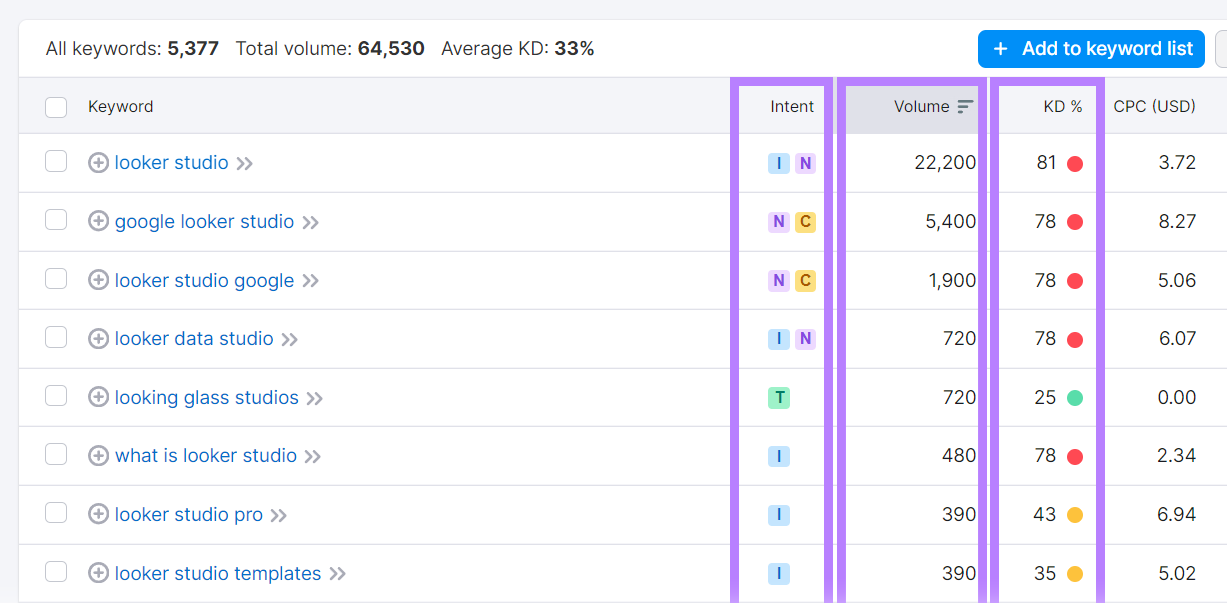
Type in “looker studio” and click “Search” to generate a list of keywords.
Look through the options and create your own list with keywords that have the following:
- Appropriate search intent: Search intent (“Intent”) is the motivation behind any search. Make sure the search intent of the keyword aligns with the goals you have for the content you plan to create.
- High search volume: Search volume (“Volume”) is the estimated number of times a keyword is searched each month. Look for a keyword with a volume of at least 100.
- Low keyword difficulty: Keyword difficulty (“KD %”) is a percentage that indicates how easy or difficult it is to rank for a keyword. Look for keywords with a score of 49% or below.
Use your keyword list to create your new pieces of content.
2. Find Declining Content to Refresh
Most websites have content that used to perform well but doesn’t anymore.
And small changes to those pieces—such as updating outdated information or better optimizing for on-page SEO—can drastically improve SEO performance.
They may be underperforming now because they’re outdated, they’ve been outperformed by a competitor article, there was an algorithm update, etc.
For example, our “What Is SEO?” article started losing traffic in January of 2022.
So, we updated and optimized it later that year. Which helped the article perform even better than it did before—as you can see in Organic Research.
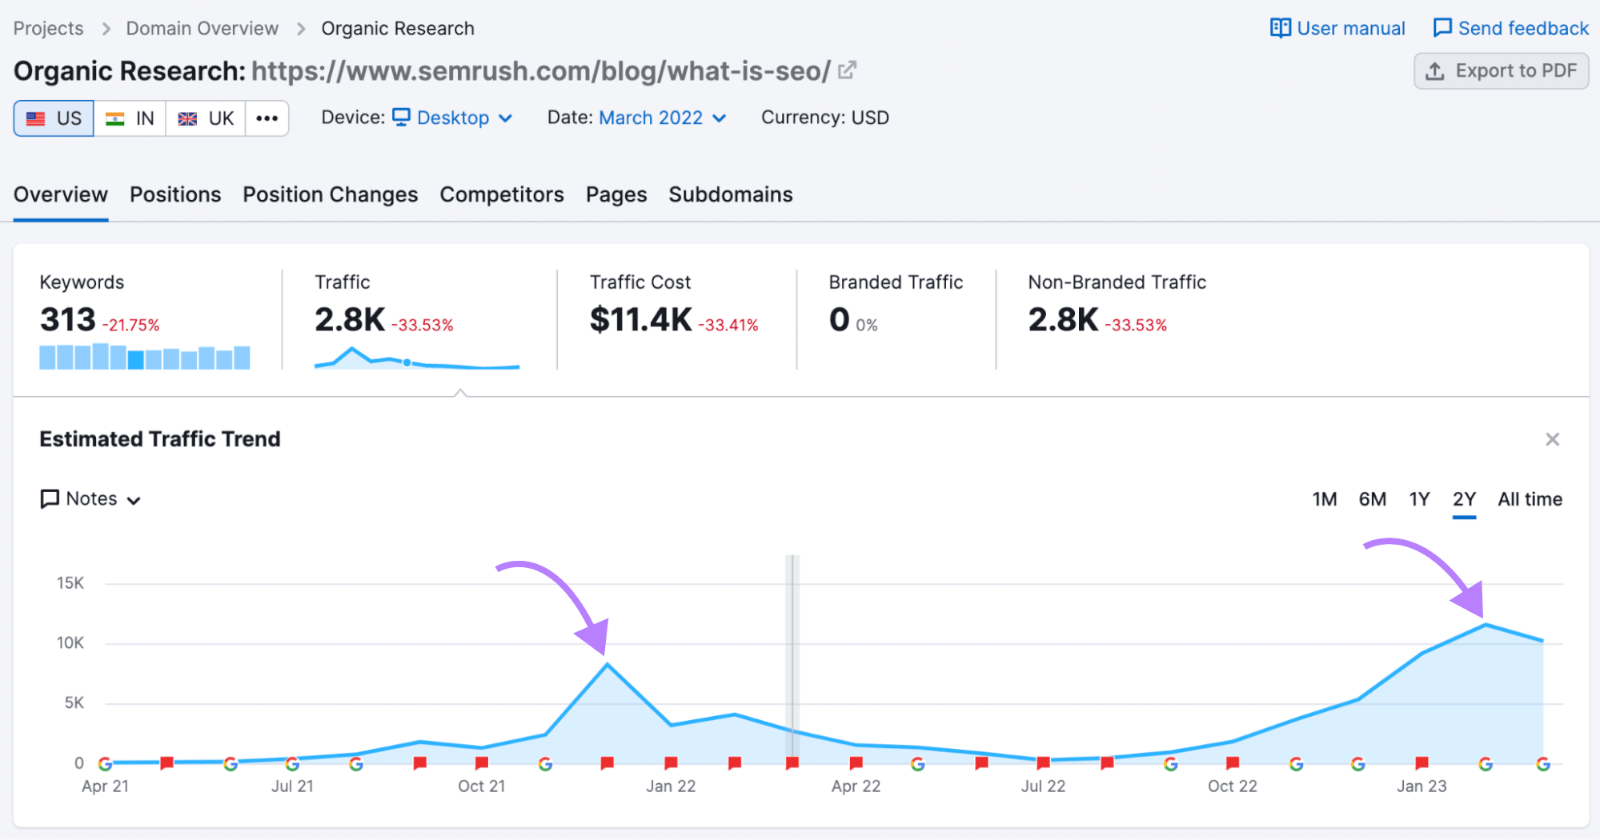
Finding these underperforming pieces is a great way to use Google Analytics for SEO.Then, you can plan content updates and get your top-ranking pieces back on track.
Here’s how to do it.
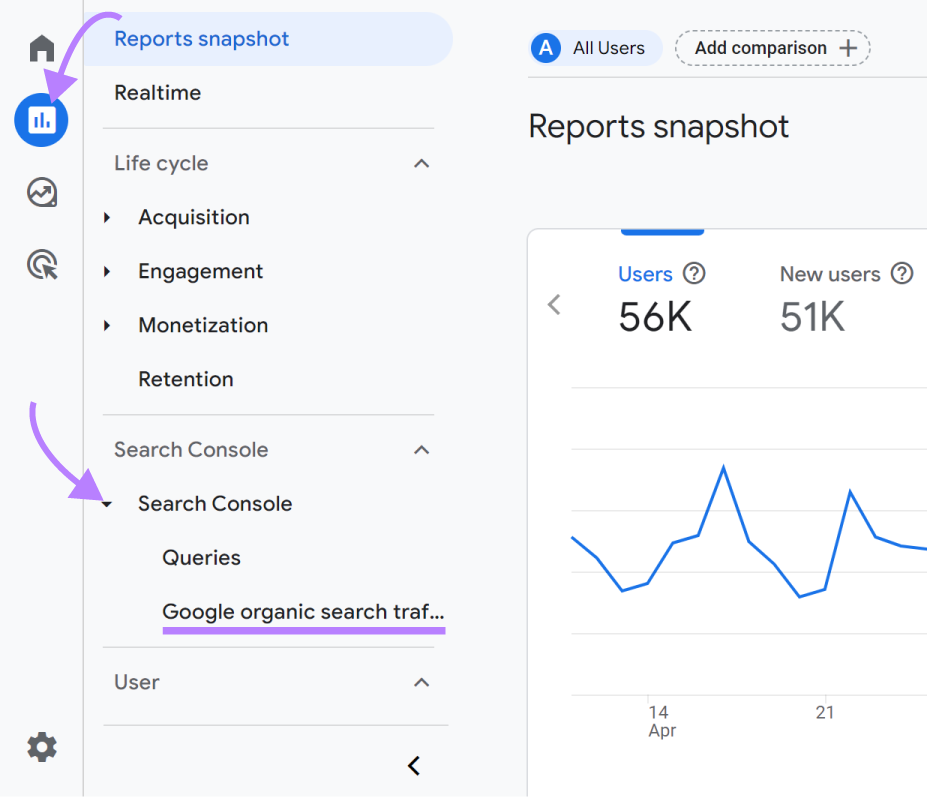
Go to “Reports” > “Search Console” > “Google organic search traffic.”
Next, look at your content’s performance over a period of time. By clicking on the dates in the upper right corner of your screen and setting your desired range.
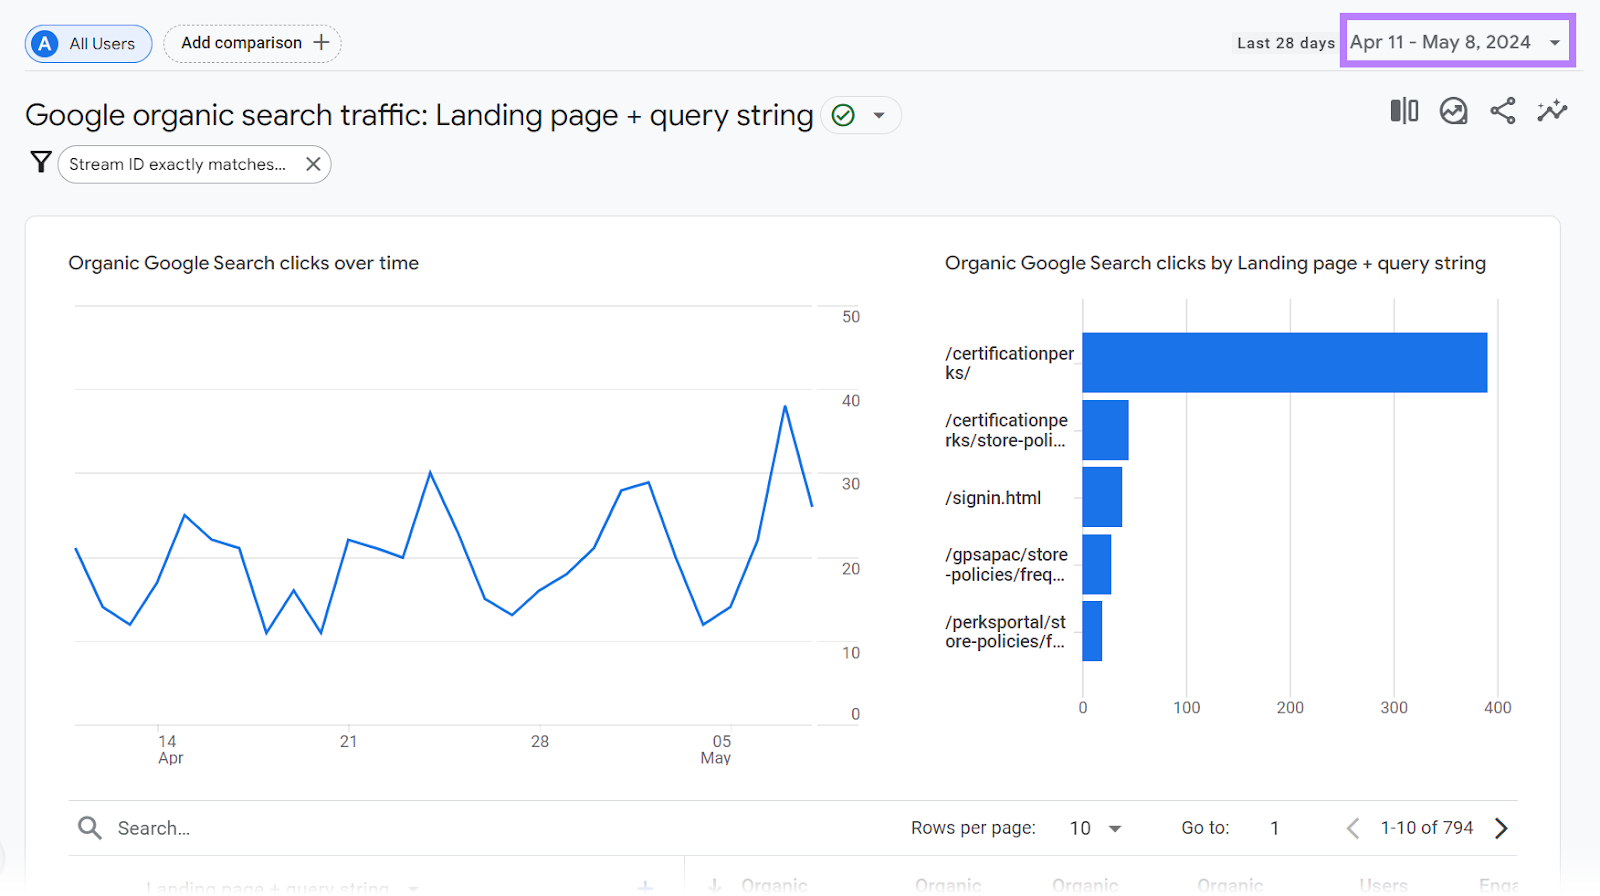
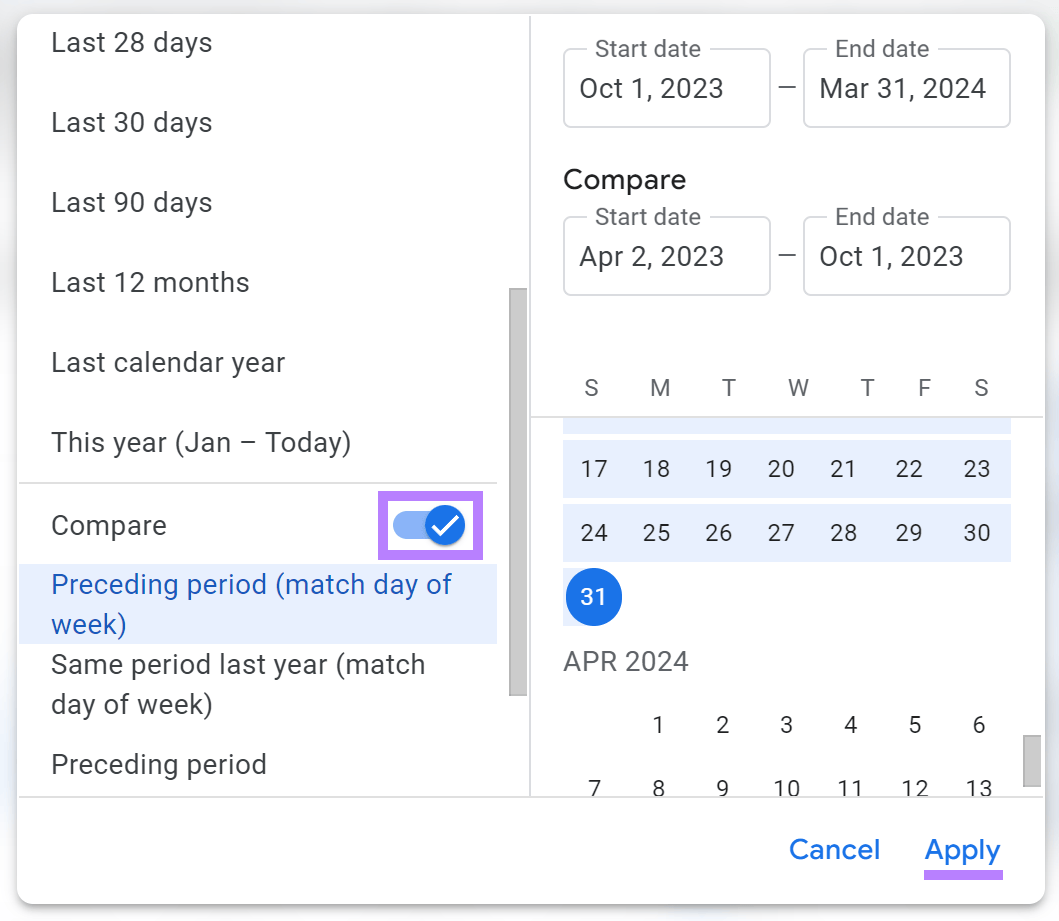
We recommend looking at content performance over the last six months. And comparing it with the previous six months by clicking on the toggle beside “Compare.”
To do this, click on “Custom” and choose the most recent six-month period. And compared it with the previous six months.
When you’ve selected your dates, click “Apply.”
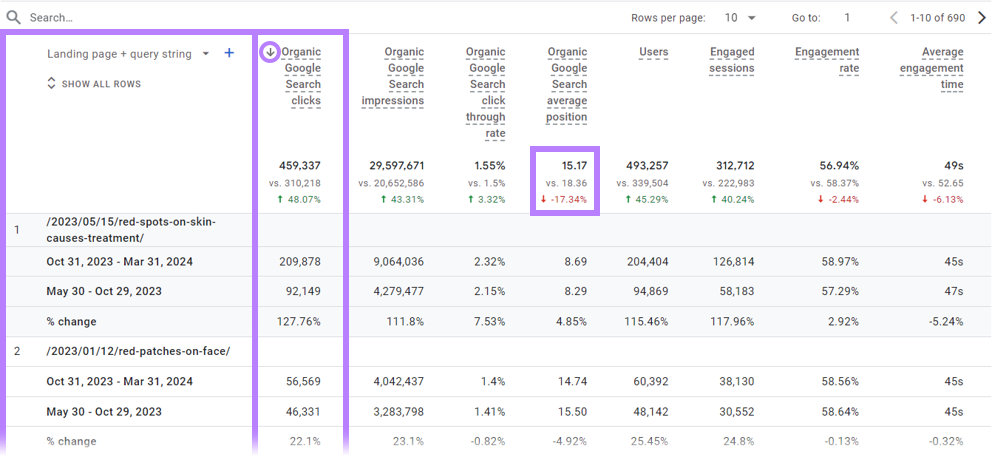
Now, you should see your top-ranking landing pages, stats for both time ranges you selected, and the percentage change between the two.
Look at the “Organic Google Search average position” column to see how your rankings have changed. The report below shows a website with improved rankings—average position went from 18.36 to 15.17.
Sort the table to display pages with the most clicks from search results by clicking the arrow next to “Organic Google Search clicks.”
If you take a closer look, you’ll see the page with the fourth most clicks has dropped in rankings.
The average search position went from 14.45 to 15.81 over the last six months. And clicks from Google are down by 55.68%.
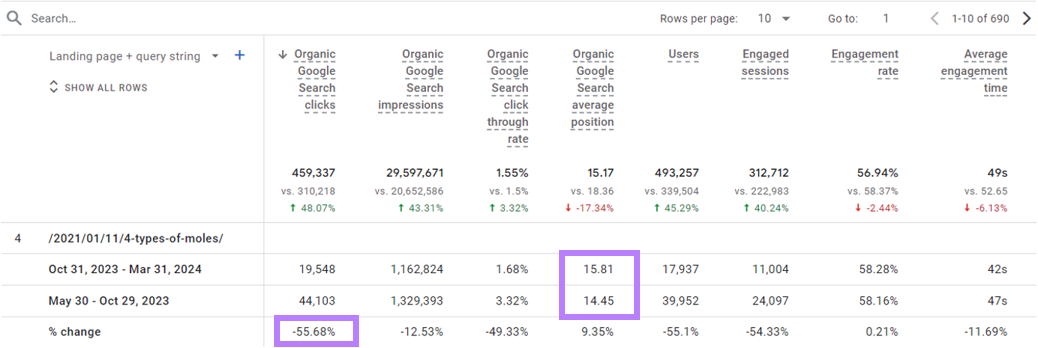
Which means that this piece is a great candidate for updating. To get clicks and rankings back up.
Next, use Semrush’s Organic Traffic Insights tool to get data that this GA4 report doesn’t provide:
- What specific keywords the page is ranking for
- Keyword search volumes and the difficulty scores for those keywords
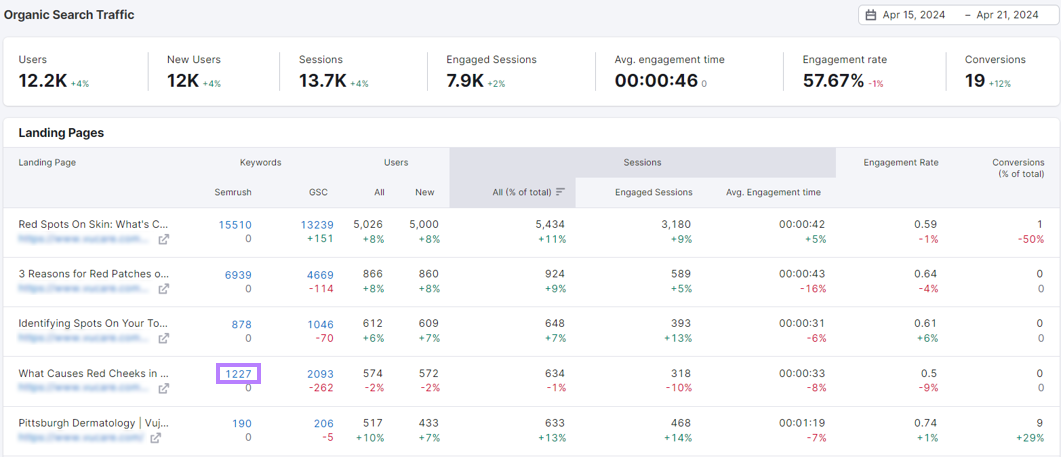
Organic Traffic Insights combines data from GA4, GSC, and Semrush. So you can easily see page data within a single dashboard.
Let’s investigate the fourth page from our GA4 report using the tool.
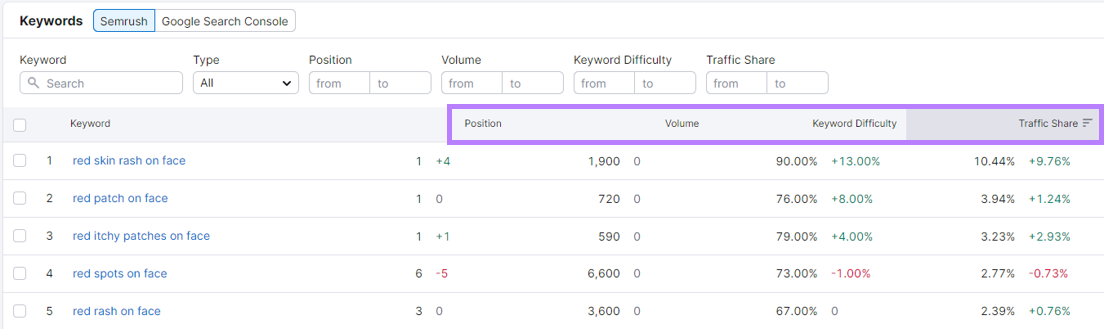
Click on the hyperlinked number under the “Semrush” column in the “Keywords” section.
You’ll get a list of keywords the page is ranking for. Along with data like:
- Position: Where you rank in search results
- Volume: The estimated number of monthly searches
- Keyword Difficulty: How difficult it is to rank for a given term expressed as a percentage, with 100% being the most difficult to rank for
- Traffic Share: The percentage of traffic that each keyword drives
Go through the list and look for keywords with high volumes that have declined in position.
For example, the fourth keyword on the list could be a major opportunity. Since it declined five spots, dropping from #1 to #6.
It also has a lot of traffic potential, with 6,600 searches each month.
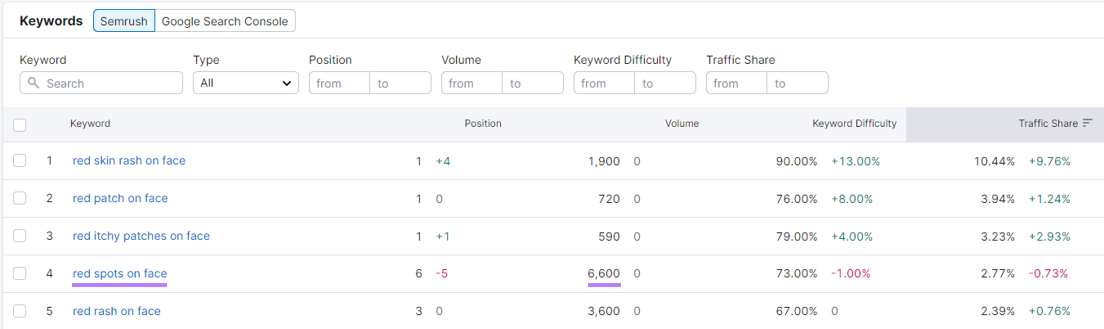
Updating your content and re-optimizing it with that specific keyword in mind could increase your ranking for it. And boost traffic.
3. Identify High-Traffic Pages to Improve
High-traffic pages have huge potential. Because even small improvements can boost performance to help you achieve marketing goals.
You can spot these high-traffic pages in GA4 by looking for pages your audience doesn’t engage with for long.
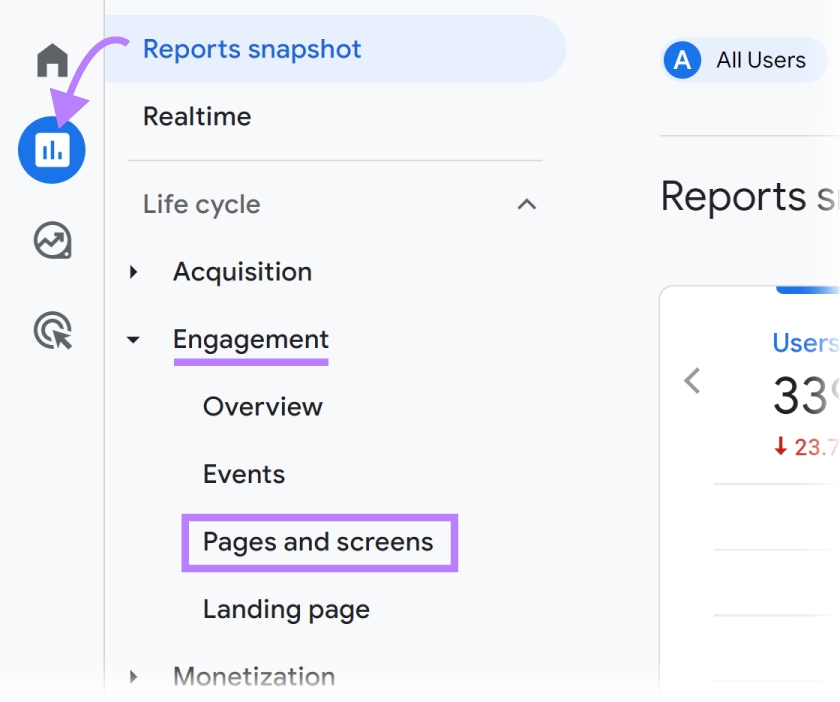
Go to “Reports” > “Engagement” > “Pages and screens” within the left-hand navigation.

You’ll see a report showing your most visited pages. Look for pages where the “Average engagement time” metric is below the site average.
For example, in the report below, the “/Google+Redesign/Stationery” page accounts for 11.8% of all views (63,454 / 536,606). But it has the lowest average engagement time of all the top pages.
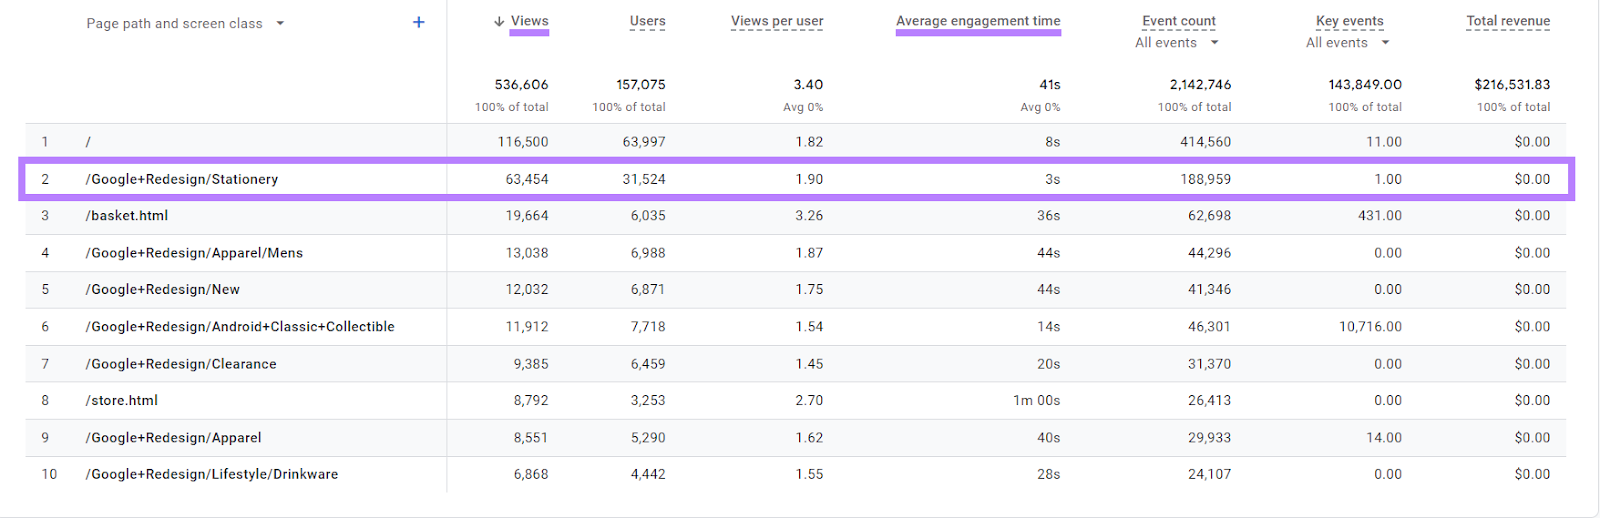
This means people are seeing the page and leaving within only three seconds of engagement.
Flag this page for your design team to review.
Or, make a note to conduct deeper analysis yourself. So you can see if there are problems like lack of alignment with search intent, distracting elements that take people off the page, etc.
4. Find Opportunities to Improve Your Conversion Rate
Conversions (called “key events” in GA4) are the most important actions visitors take on your website. And the more frequently they occur, the more efficient your website is at driving business value.
For example, a conversion for an ecommerce site could be a completed purchase. For a blog owner with an email newsletter, it might be a new email subscriber.
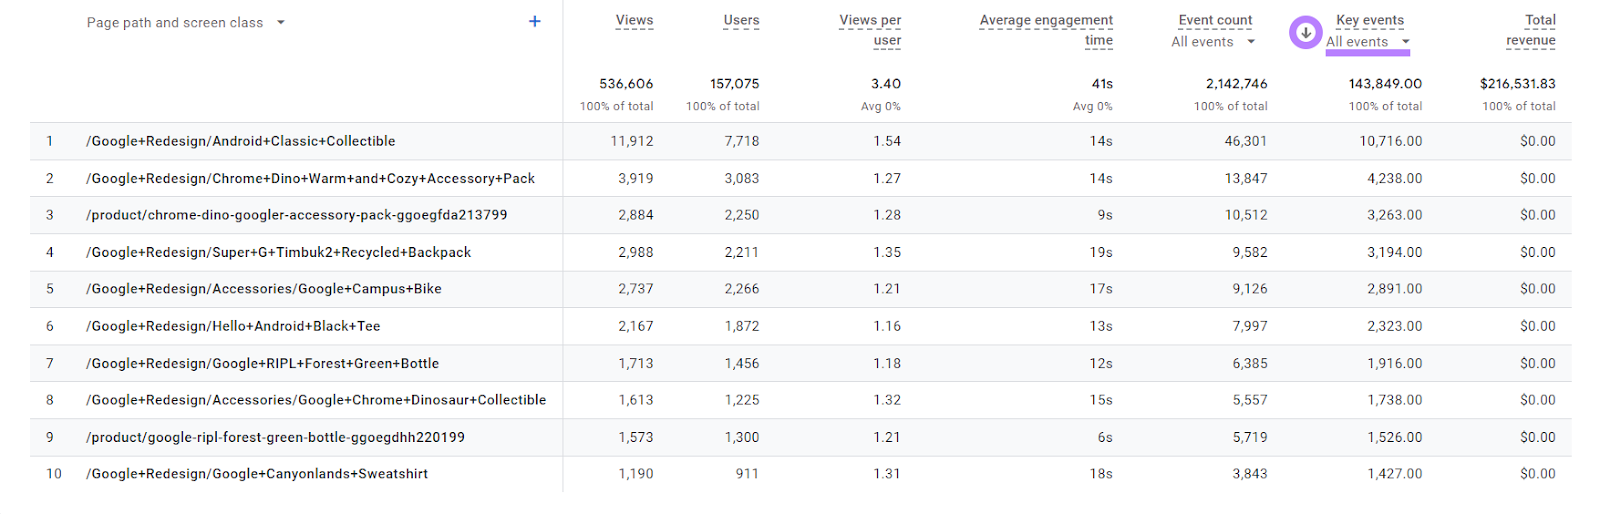
To find your conversion rate, go to the “Reports” > “Engagement” > “Pages and screens.”
Click the arrow to the left of the “Key events” column header to sort it in descending order.
Then, click on the “All events” drop-down.
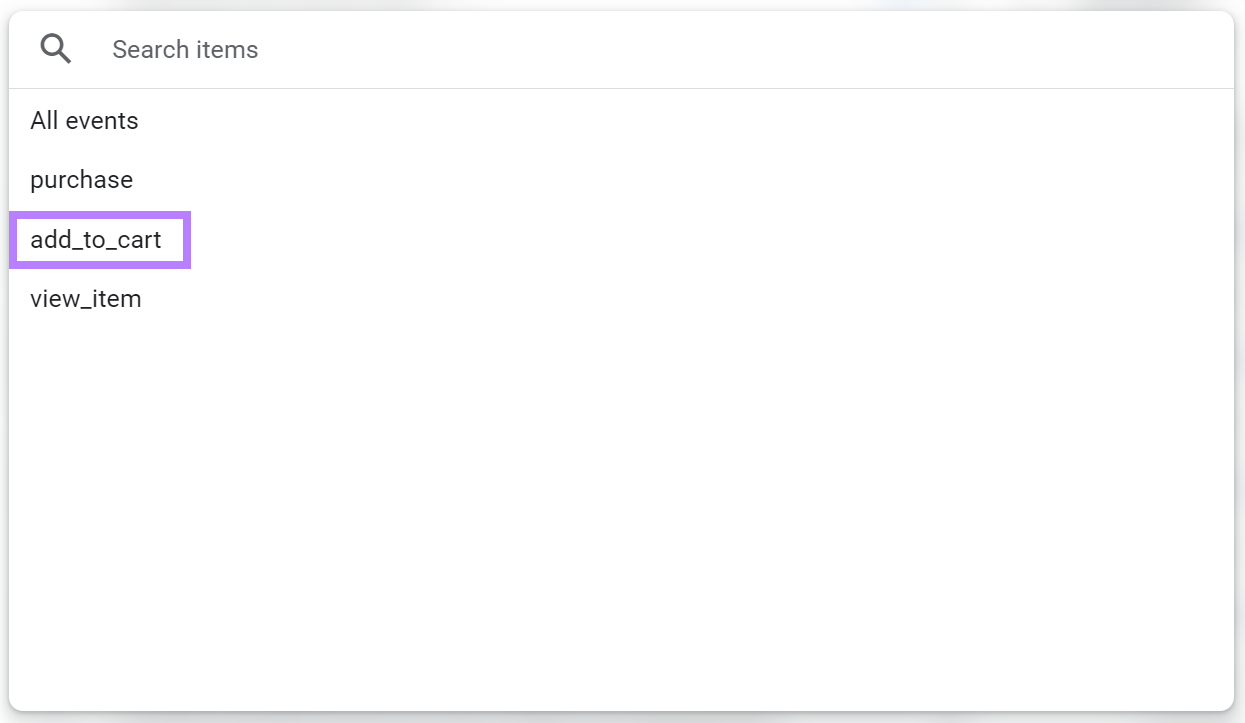
Select an individual key event (conversion action) to analyze. Let’s choose the “add_to_cart” event. Which is important for ecommerce sites.
Now, you’ll see a list of the top pages where the “add_to_cart” event occurs.
You can compare the number of “add_to_cart” events to the total number of views. To get your conversion rate and find page-level opportunities for improvement.
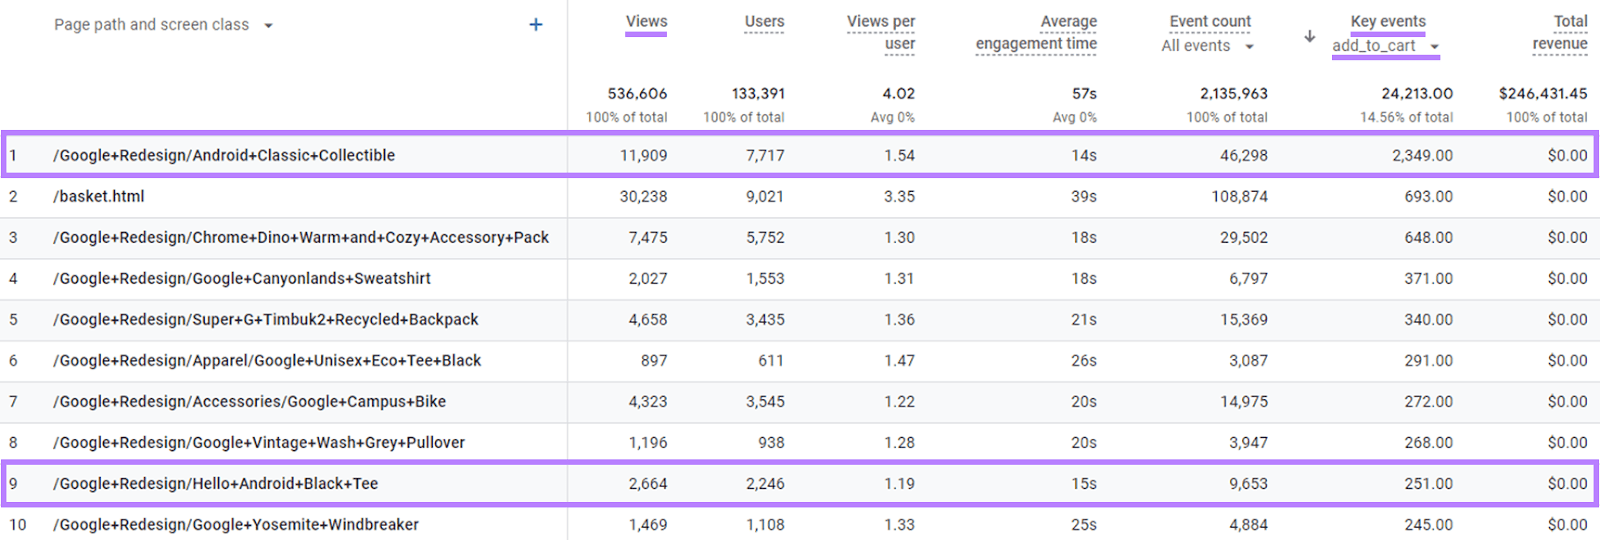
Here’s an example:
The first page on the list has a conversion rate of 19.7% (2,349 “add_to_cart” events / 11,909 views). That’s more than twice as high as the conversion rate for the ninth page on the list, which has a conversion rate of 9.4% (251 / 2,664).
If you do a comparative analysis of the two pages, you may spot opportunities that can boost the conversion rate of that latter page.
5. Discover Site Issues
You can use Google Analytics for SEO traffic alerts that send email notifications if your visitor counts fall or rise outside of your expected range.
This keeps you informed about new traffic gains. And shows you signs of potential SEO issues, so you can respond.
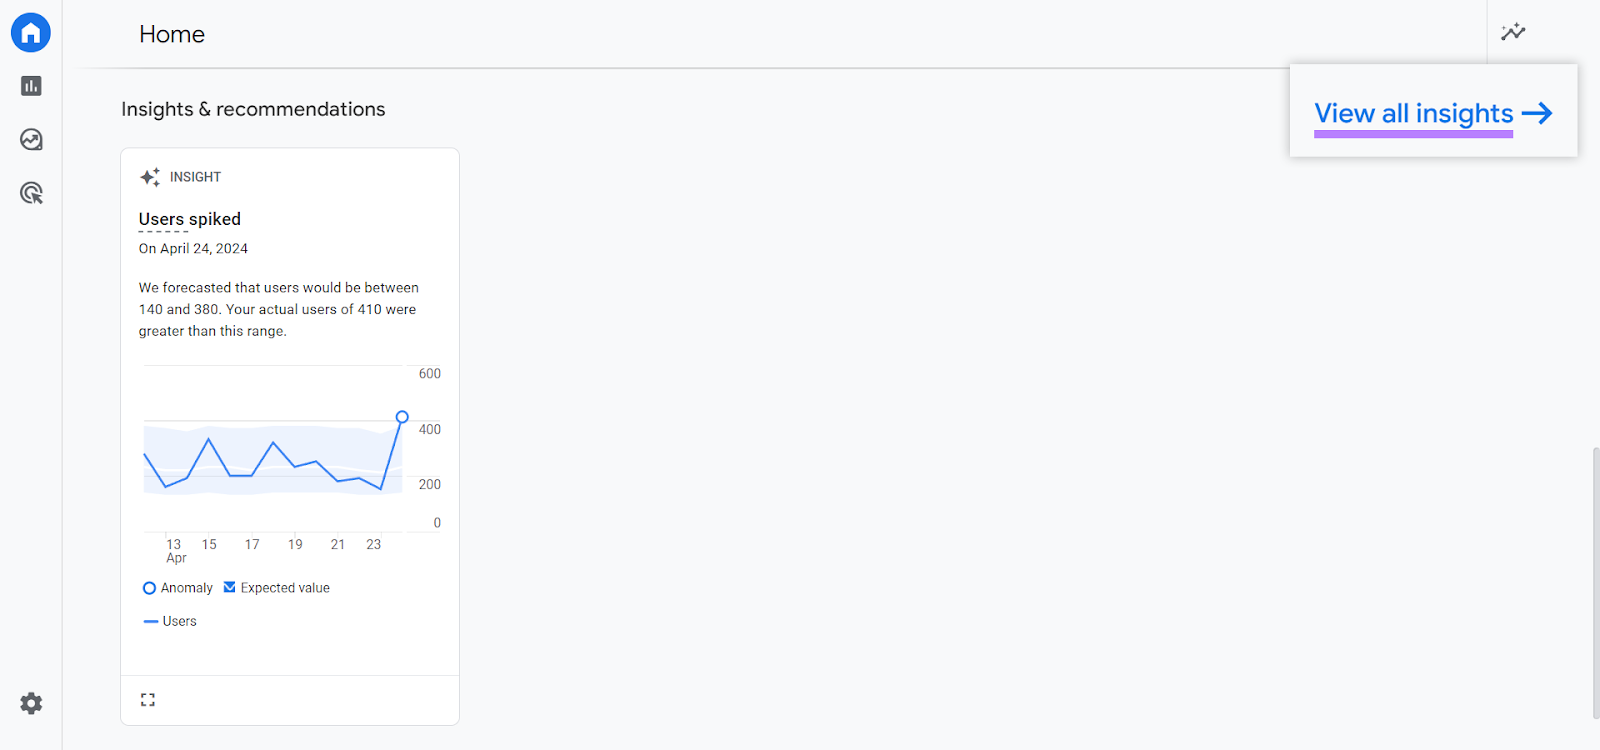
First, you need to set up custom alerts from the “Home” screen.
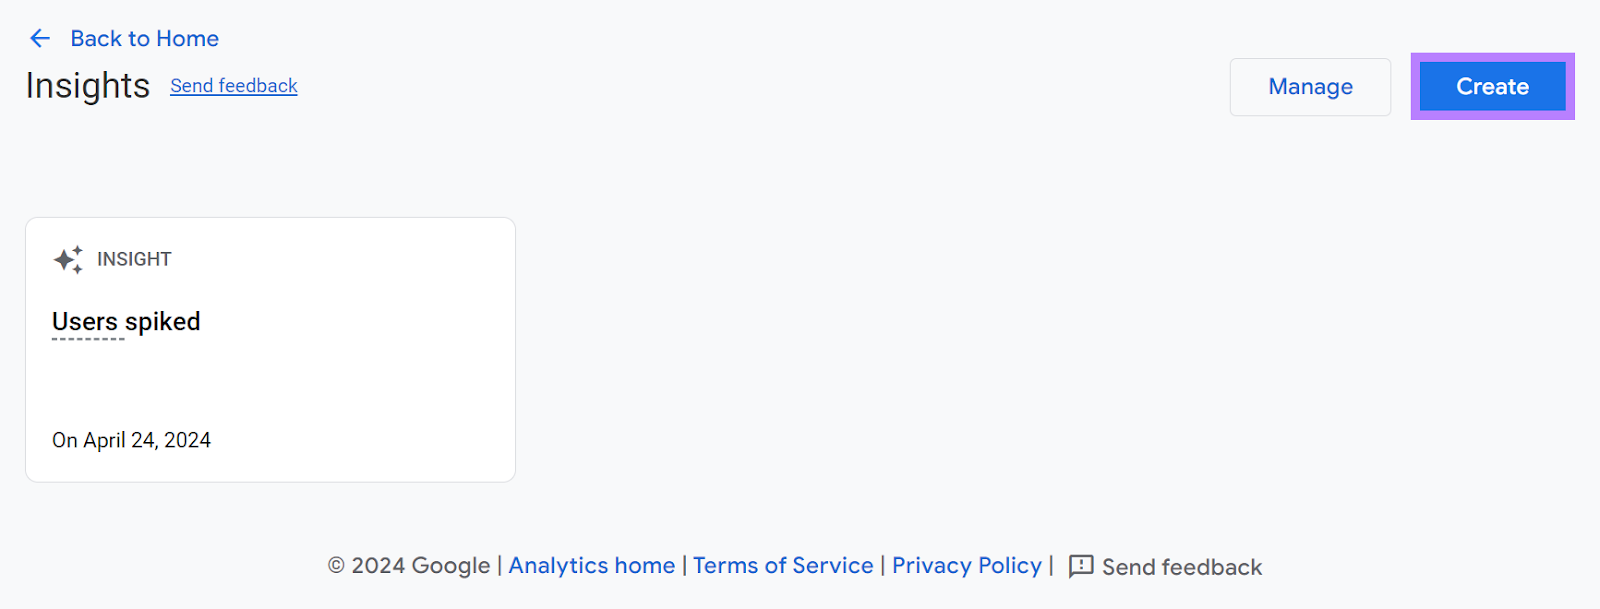
Scroll down to “Insights & recommendations” at the bottom and click “View all insights.”
Then, click “Create.”
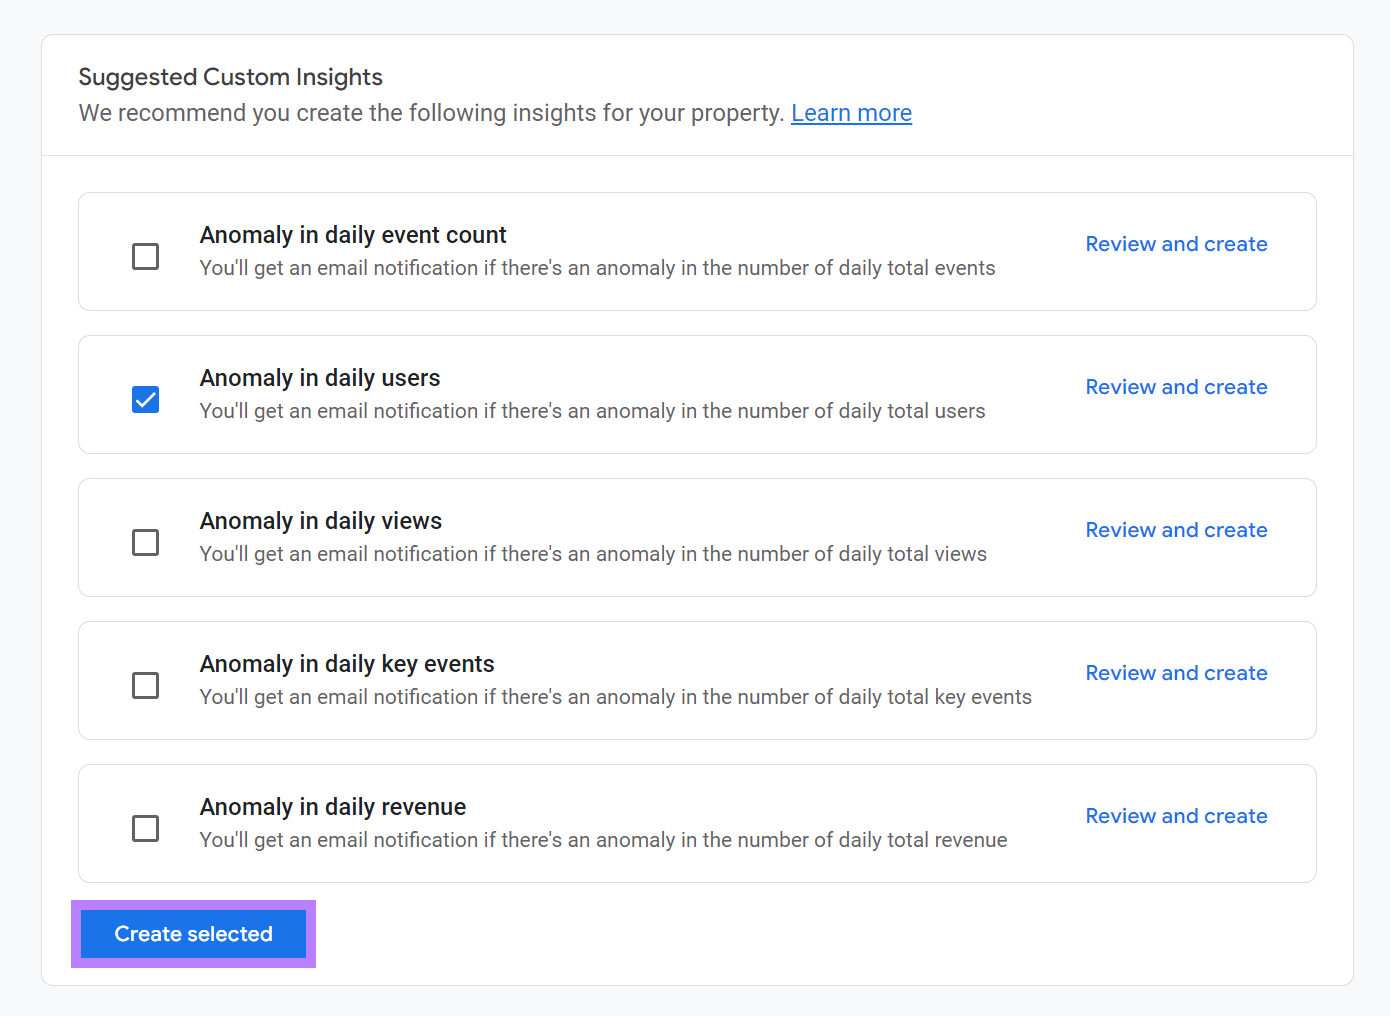
You’ll see five suggested custom insights. You can start small by only monitoring your daily users.
So, uncheck the boxes from the insights other than “Anomaly in daily users” and click “Create selected.”
You’ve now created an insight that will show on your homepage when Google Analytics detects an anomaly in your data.
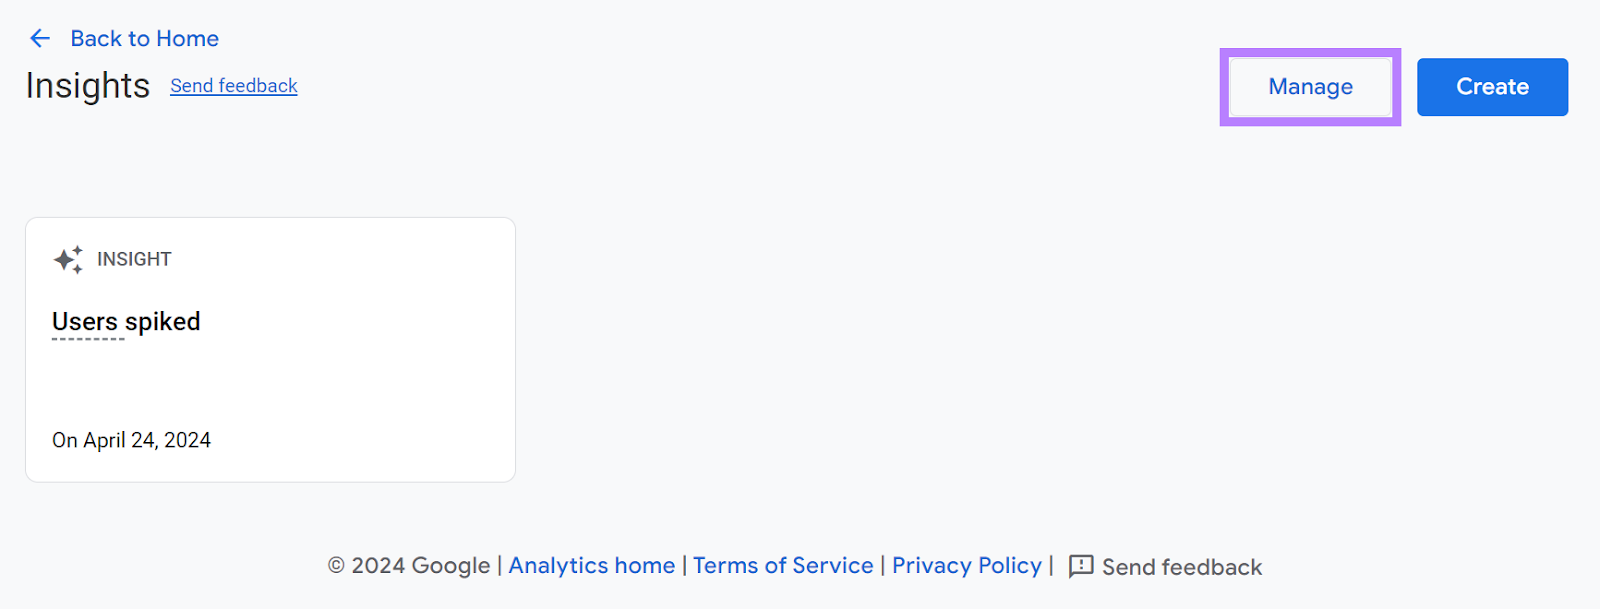
You can set up email alerts as well.
To do that, click “Manage.”
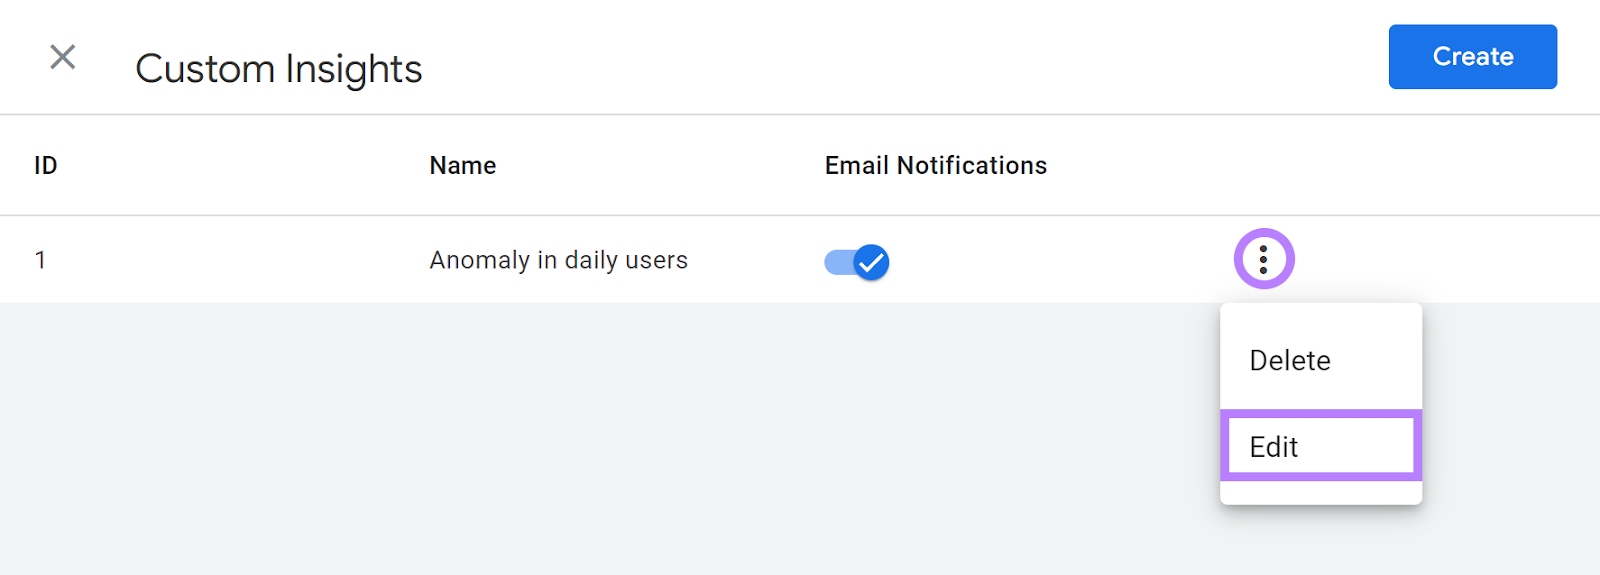
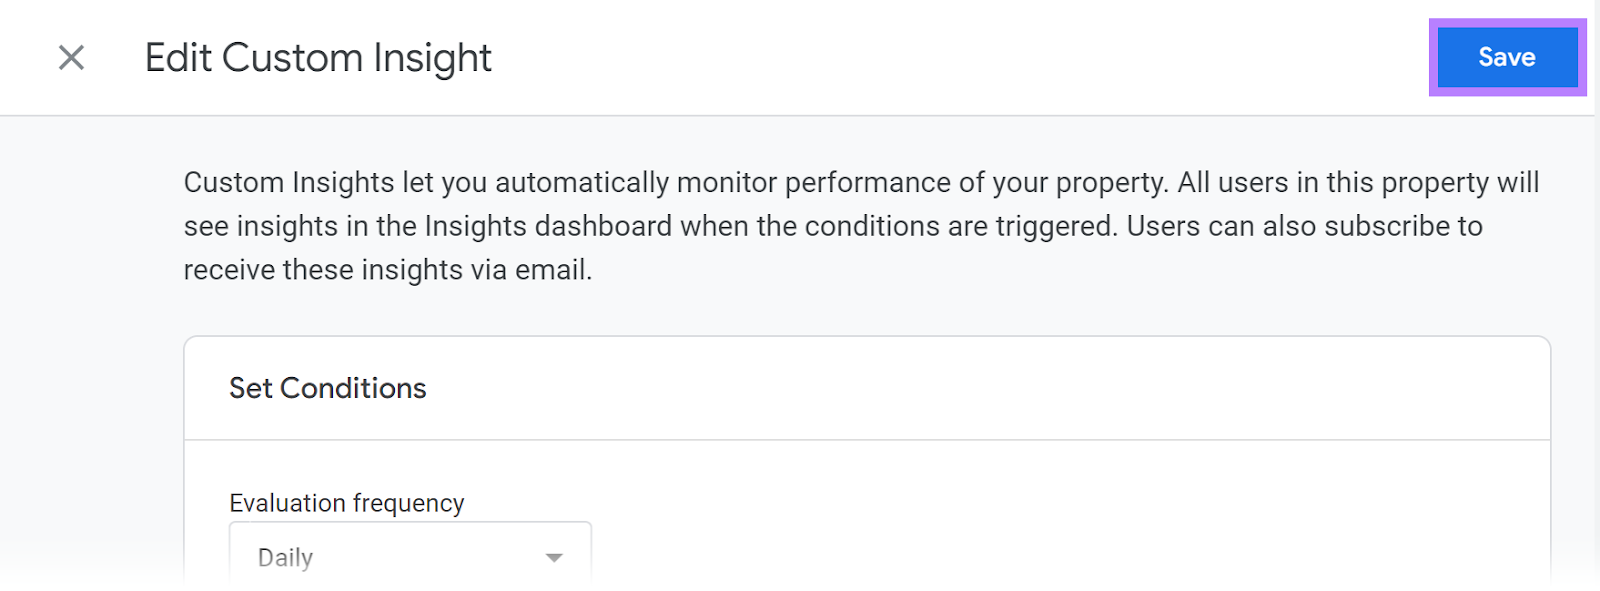
Turn on email notifications next to the Custom Insight you created and add other people to the notification list (if needed) by clicking the three dots and selecting “Edit.”
Scroll down and add email addresses for users with access to your GA4 property who should receive notifications.
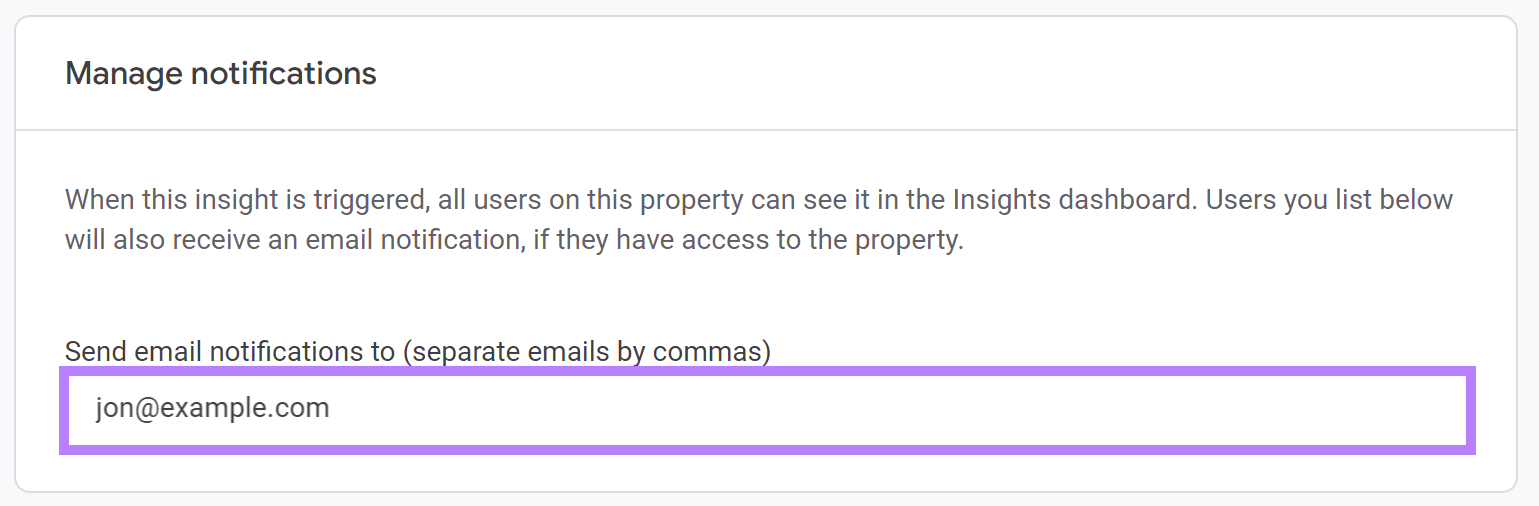
And click “Save.”
You can now stay on top of traffic changes that suggest a problem needs to be fixed.
When you get a notification like this, use Site Audit—free SEO audit tool that shows technical and on-page errors.
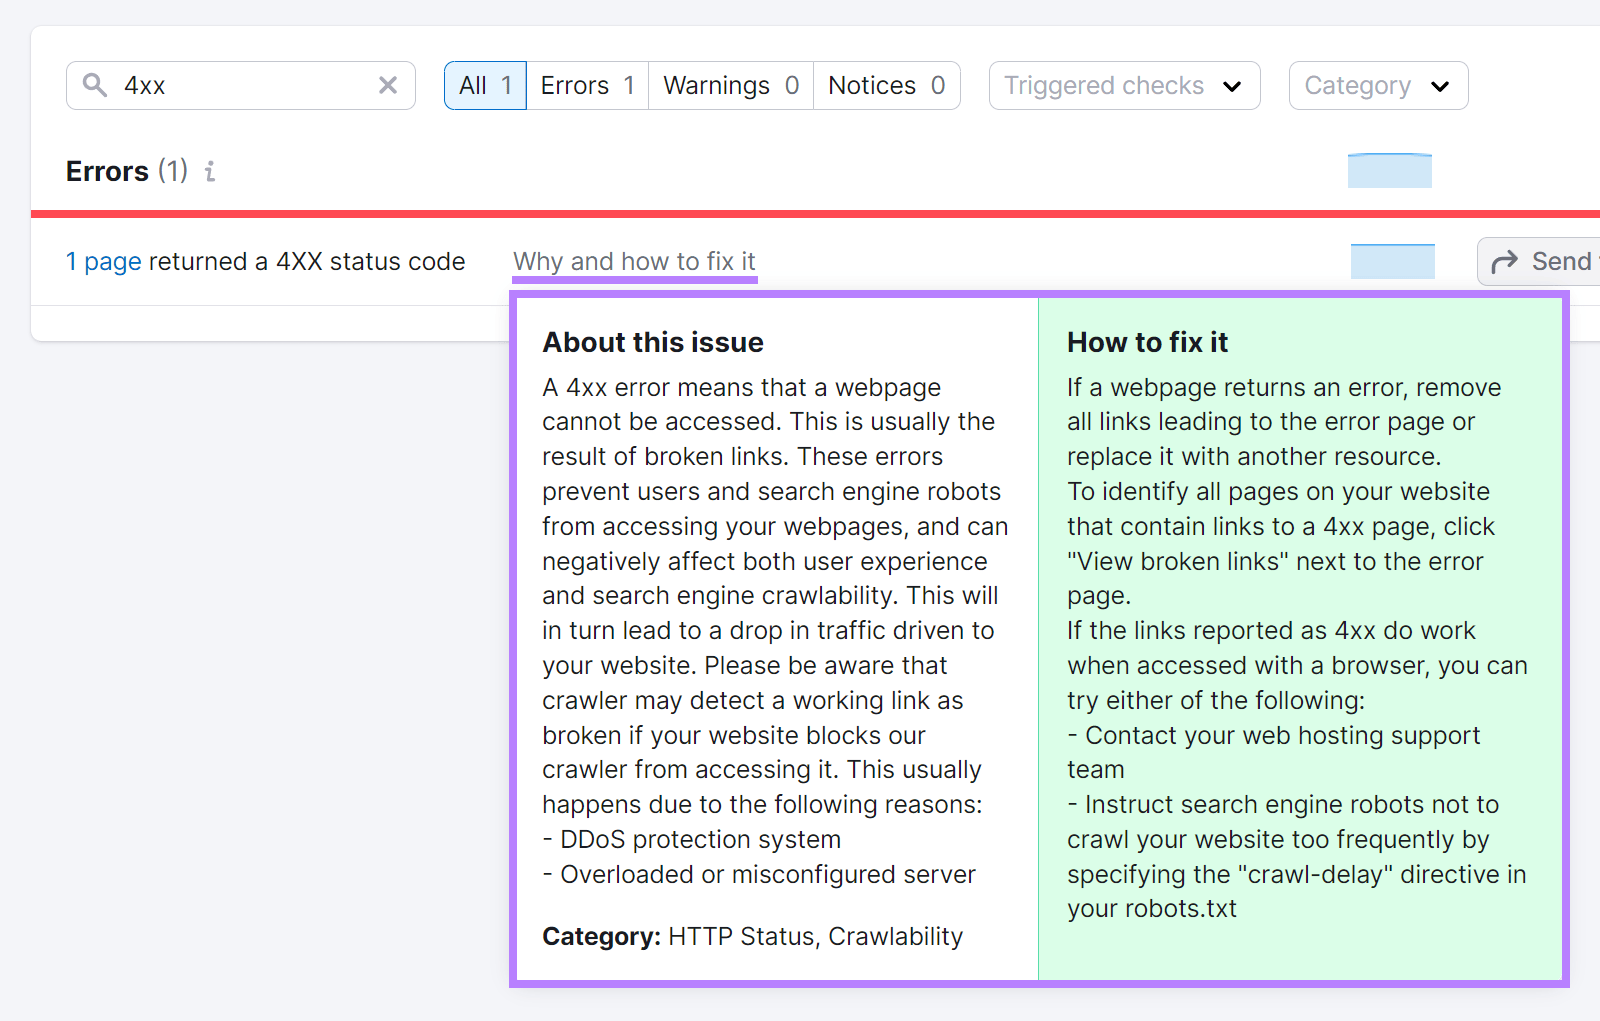
For example, it will show if your site has 404 errors. Which occur when the server can’t find the resource at a particular URL.
Once you configure Site Audit, let the tool run, and then click on the “Issues” tab. And search for “4xx” in the search bar provided.
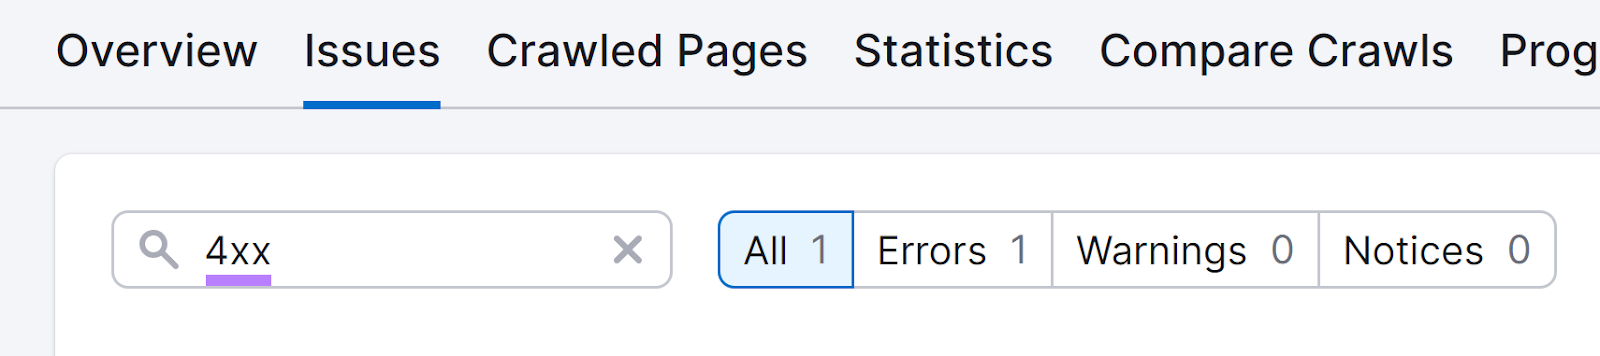
You’ll see a list of errors related to your search. Click on the hyperlinked text to get more details about the issue and how to address it.
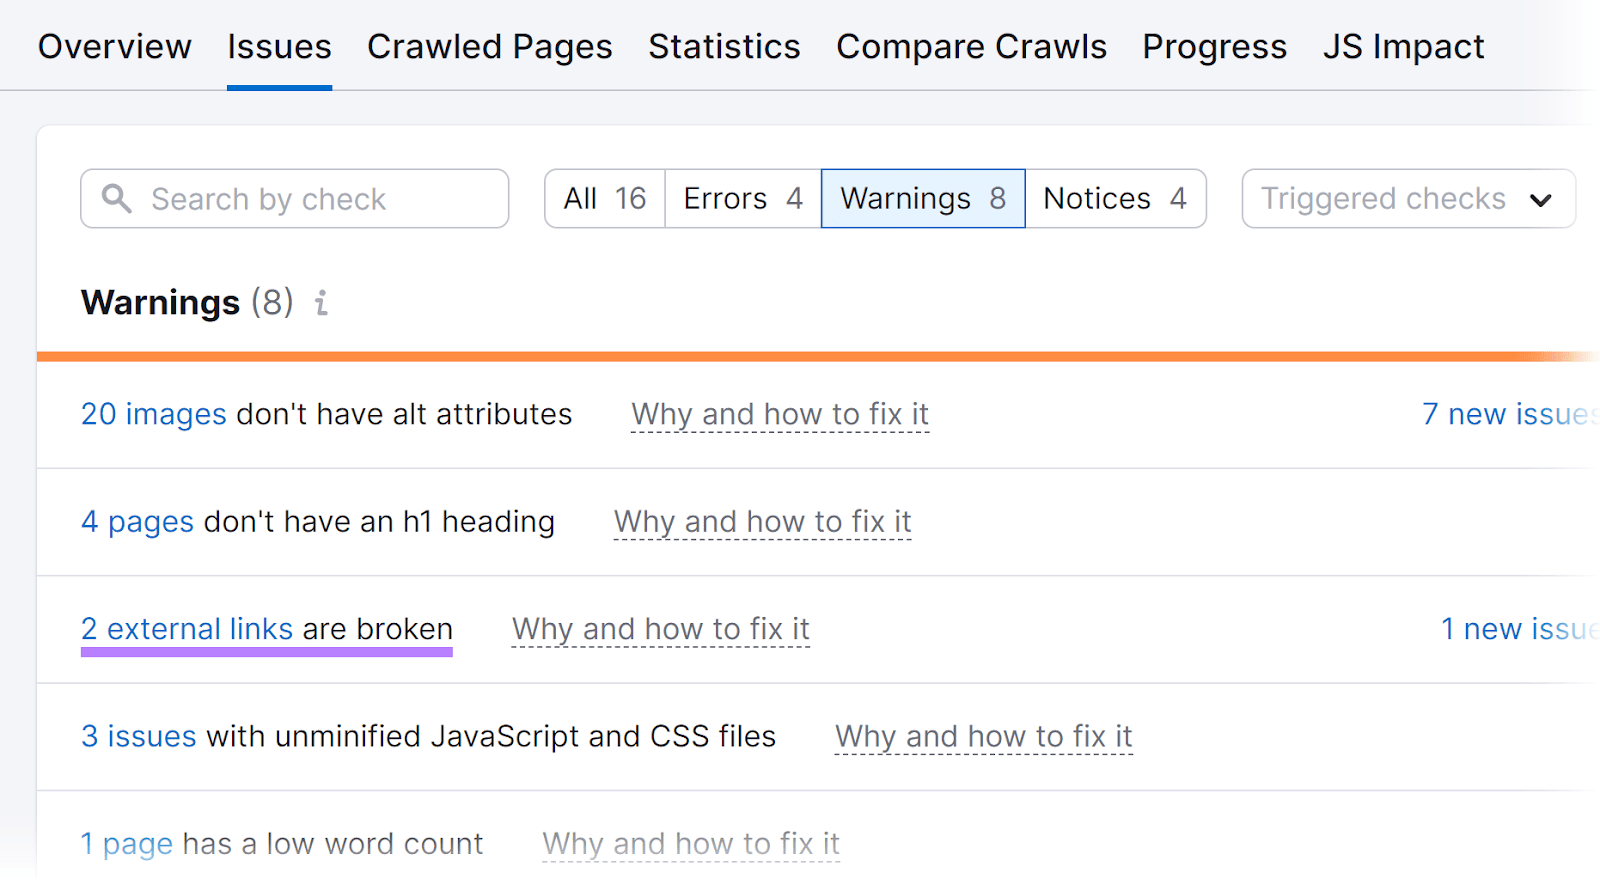
You can also see other SEO problems in the “Issues” tab. Like:
- Images without alt text
- Duplicate H1 and title tags
- Broken external links
For example, this report shows two instances of broken external links.
You can keep your site’s SEO in good shape by re-running your audit when you receive alerts about negative traffic changes.
6. Track What Impact Your Changes Have
You can expect to see performance improvements when you use Google Analytics for SEO. And you can map your results to your actions by recording what you’ve done.
Reviewing notes over time will show you what works best for your site. So you can share SEO wins with the rest of your organization.
GA4 doesn’t include an annotations feature, but you can use Google Sheets to create a simple tracking document like this:
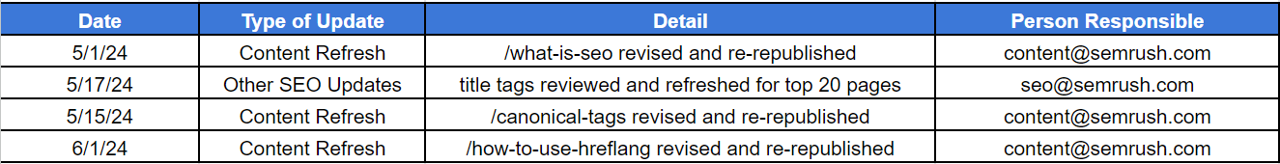
Be sure to record the date accurately. To spot the performance impact in your Google Analytics reports.
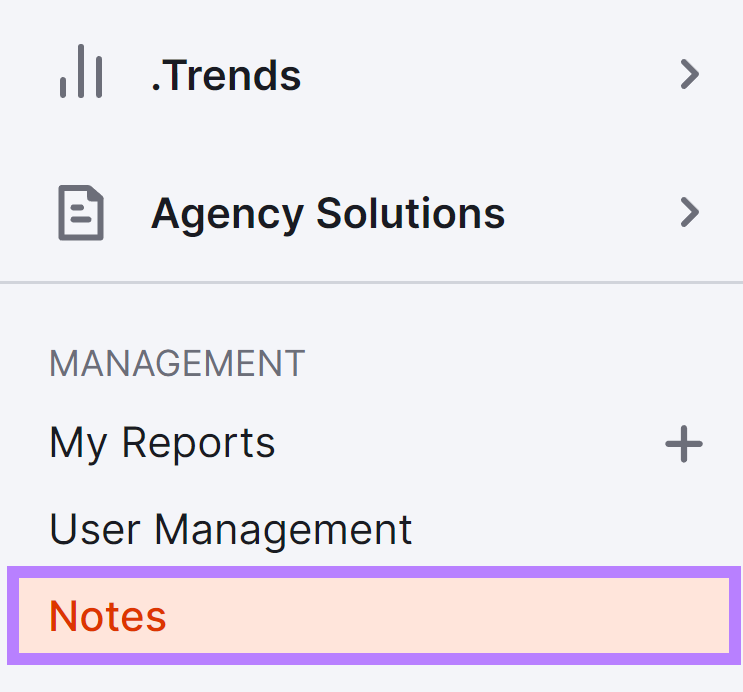
To track these important updates in Semrush tools, use Semrush Notes.
Let’s say you wanted to log when you refreshed your “/what-is-seo” article.
First, click “Notes” in the left-hand Semrush navigation.
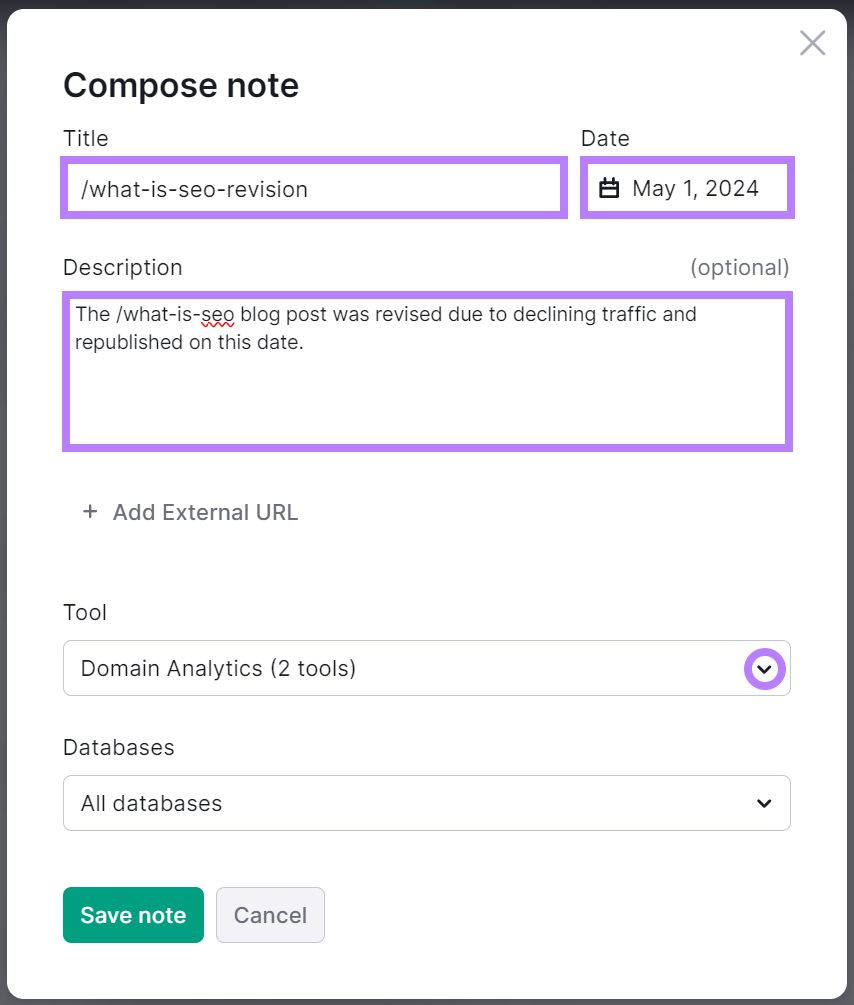
Then, click the green “Compose note” button.
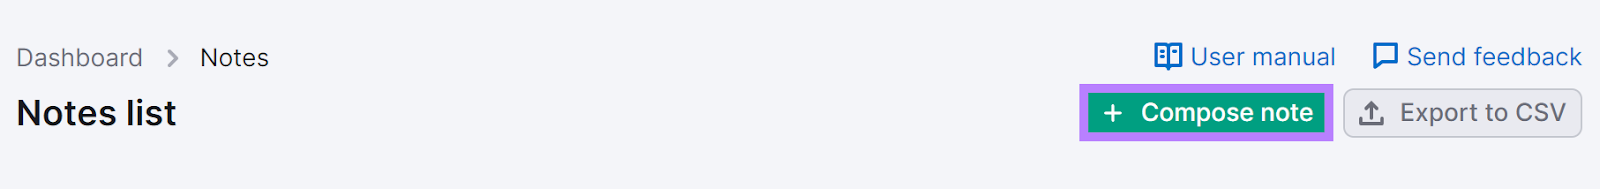
Compose your note by entering a title, date, and description.
Click the drop-down arrow in the “Tool” field to select all the places you’d like to publish the note.
Add the Position Tracking tool by clicking the checkbox to the left of the tool’s name.
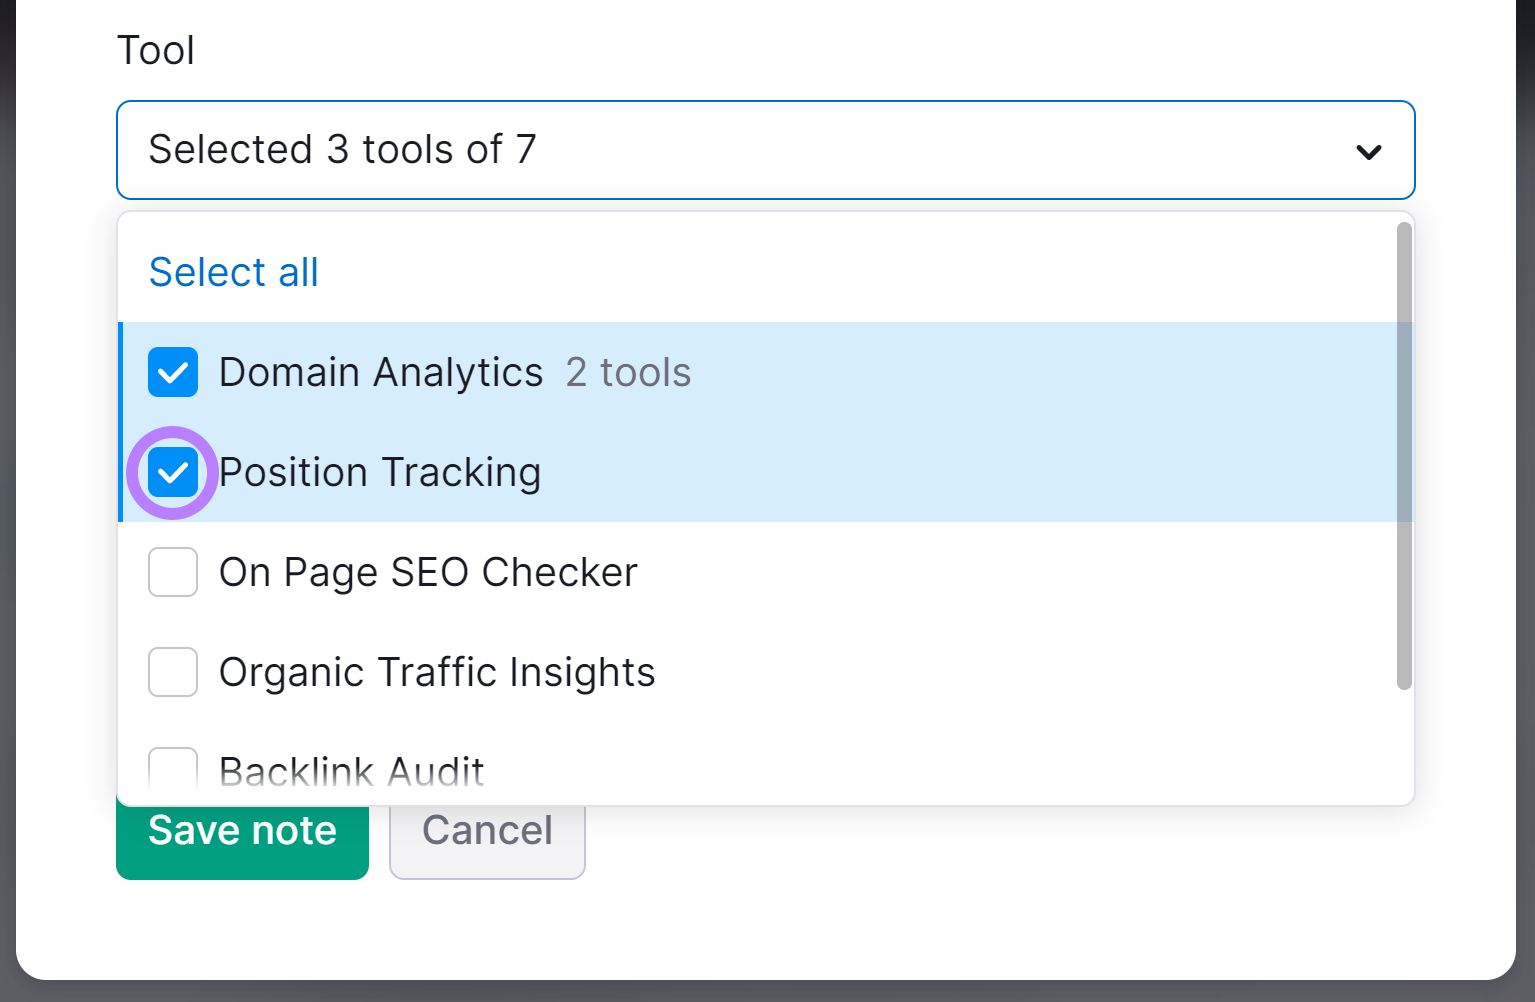
Then, click “Save note.”
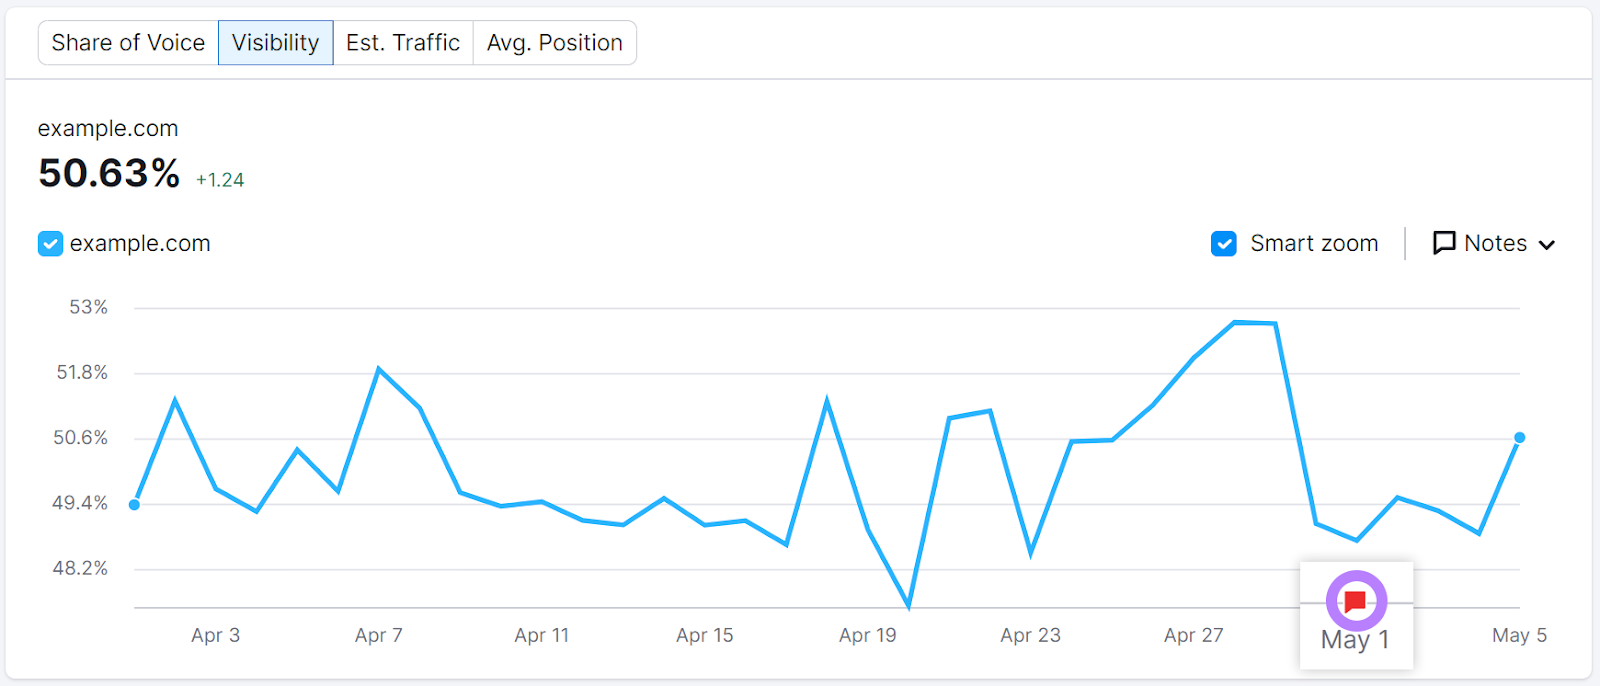
Now, you’ll see a red flag marking the date of your note when you access Position Tracking.
And when you click the flag, you’ll see the note.
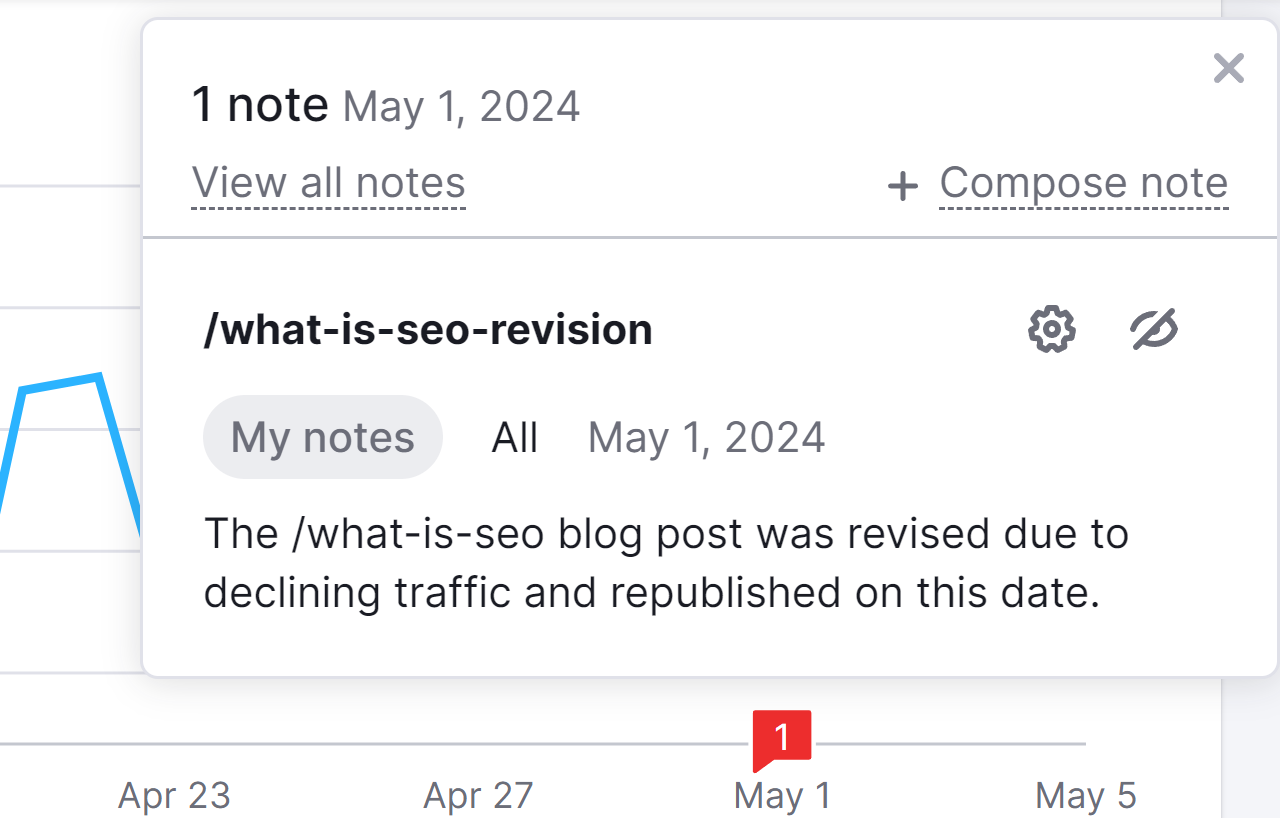
Having the note embedded in the graph makes it easier to connect your SEO results with your specific actions.
Use Google Analytics for SEO Success
Google Analytics gives you tons of useful SEO-related insights you can use.
And Semrush takes you from a simple insight to action.
Want to see how it can help you improve your results? Sign up for a free Semrush account today to see for yourself.