The Semrush Sensor tracks volatility of Google’s SERPs based on daily changes in rankings to monitor any signs that could indicate an update to Google’s algorithm. Since Google updates its ranking algorithm often, their results pages can change all the time. By letting this tool monitor Google’s behavior for you, you can determine if the industries you operate in are more or less susceptible to change compared to the rest of Google’s search results.
- Industry/category-based volatility scores
- Scores updated daily
- Integration with Position Tracking to measure the volatility of your own custom set of target keywords
- Monitor the volatility of over 30 different SERP Features
- Compare the presence of AMP, and HTTPS across industries and countries
- Set up notifications to stay informed of any major volatility
Notice Google Algorithm Changes
Google is constantly updating its ranking algorithm as Internet trends and search behavior evolves. While this is good for improving the quality of user experience on Google, it can lead to some problems for your SEO if you are not diligent in your site maintenance. This where Sensor can play a huge role in maintaining your site in order to reflect any potential updates that took place in Google.
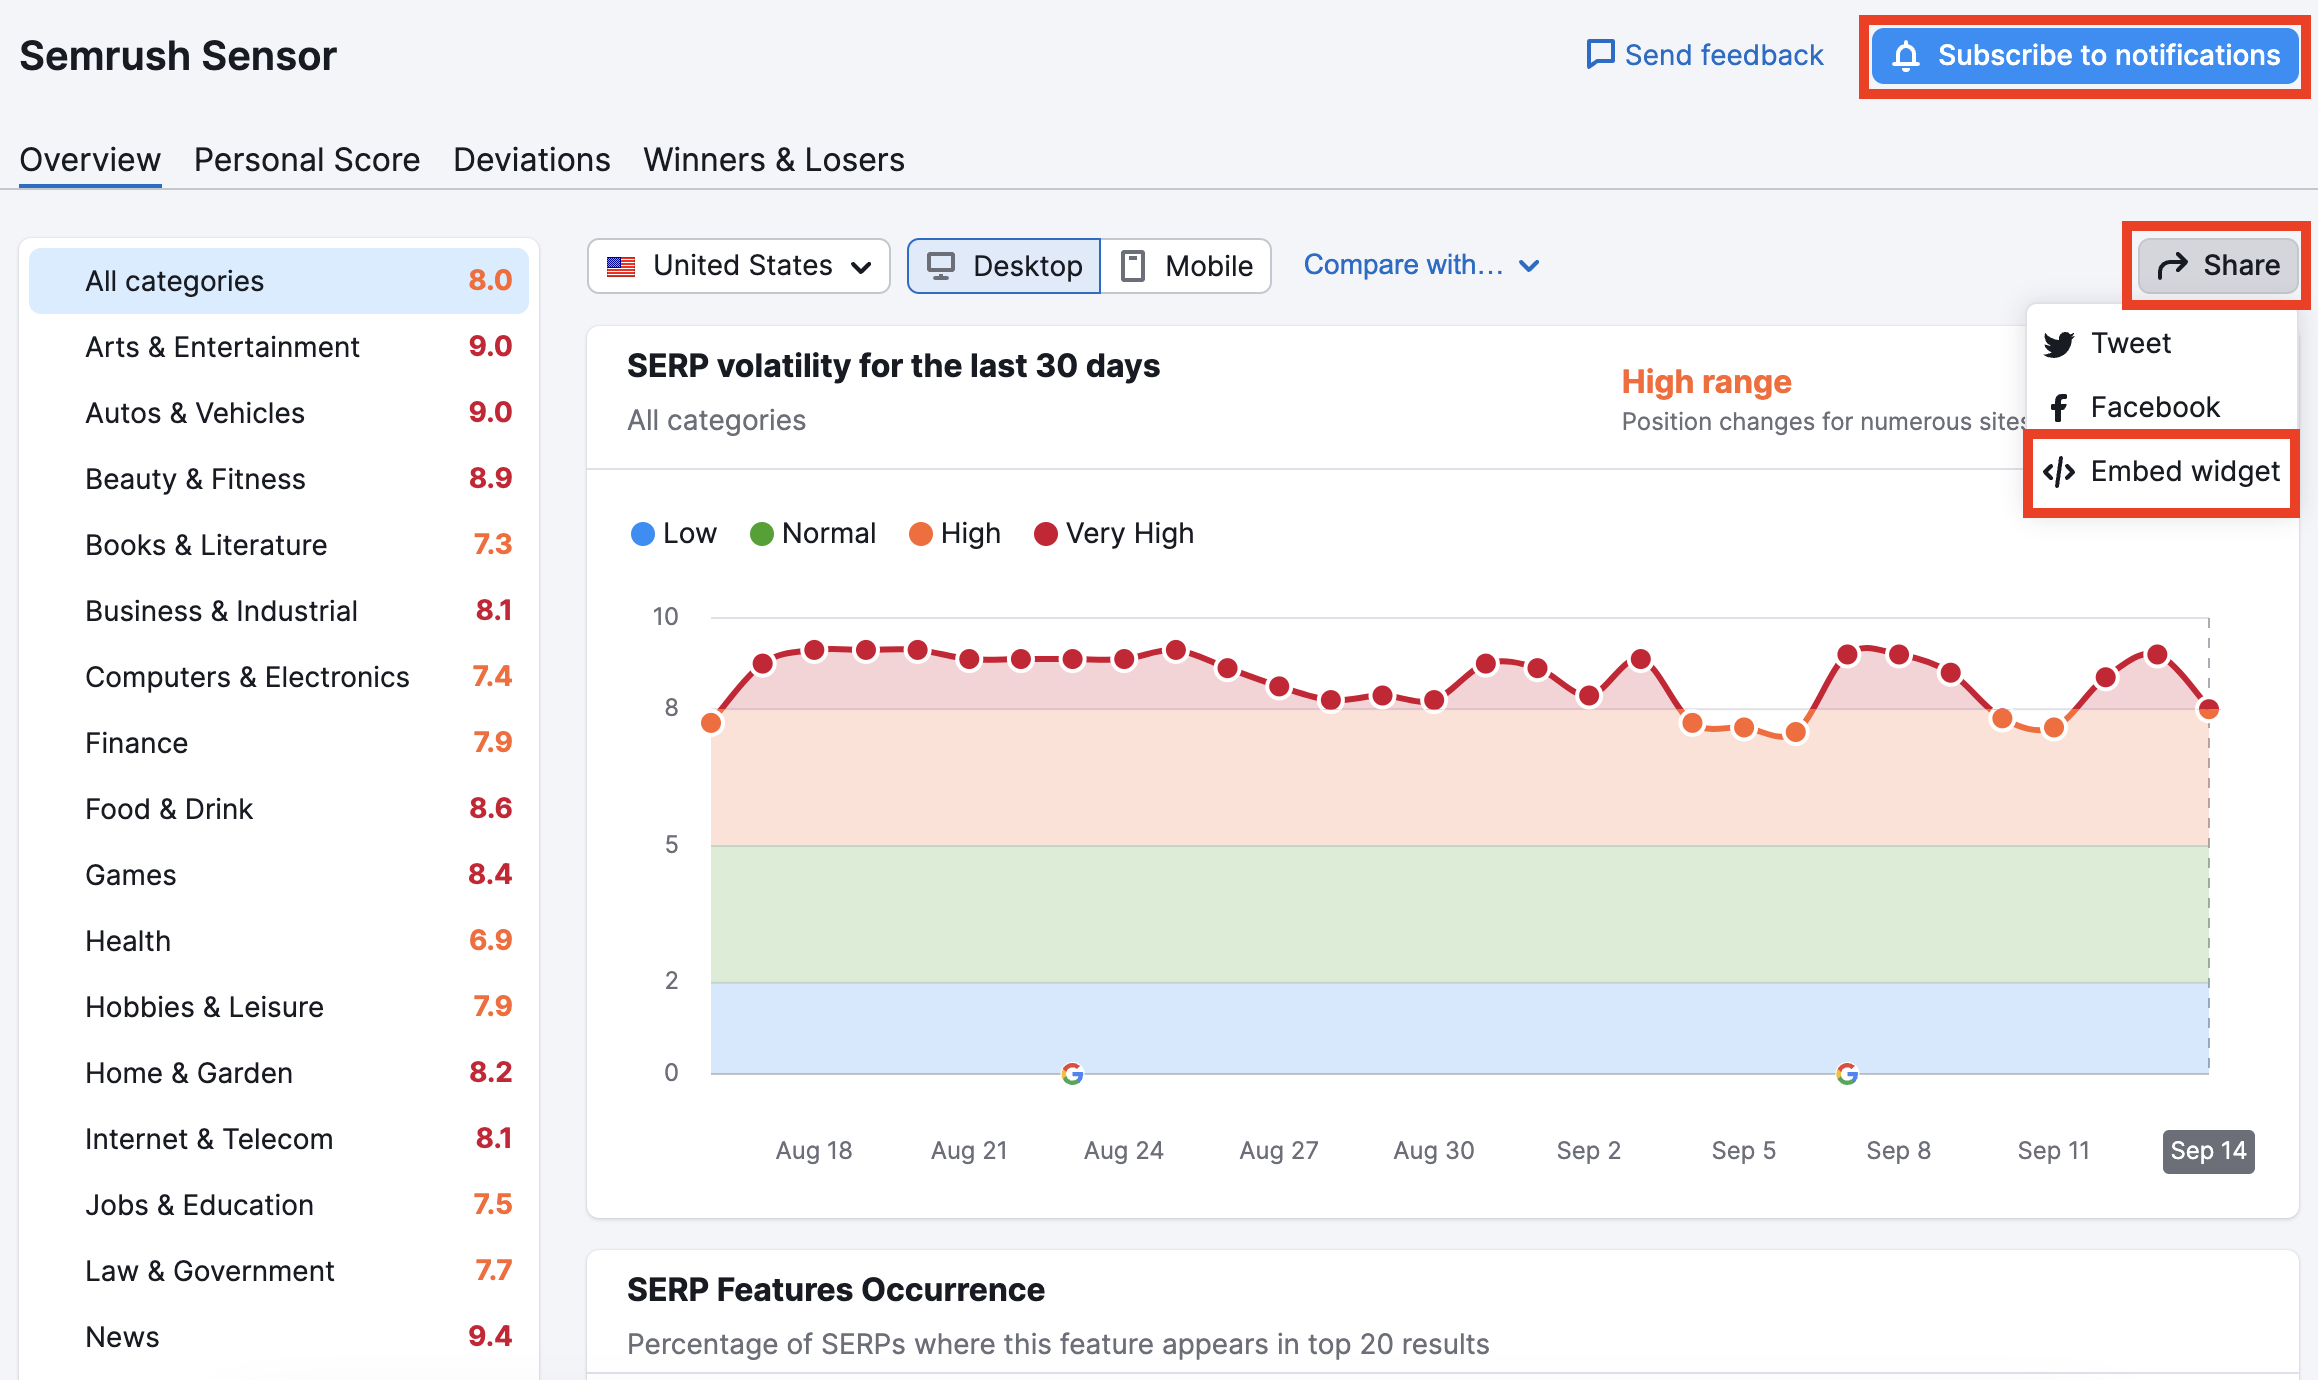
Sensor measures SERP volatility on a scale of 0-10 to indicate how much overall change is happening day to day. If there’s a high score, it means that rankings are fluctuating and you could lose or gain positions. If there’s a low score, your rankings are more likely to remain stable. To calculate this score, Semrush uses a proprietary formula that checks the changes in search results for a fixed set of keywords on a daily basis.
In terms of volatility, anything ranked between 0-2 is considered low, 2-5 is normal, 5-8 is high and 8-10 is very high. Naturally, the higher these numbers are on a given day, the more likely a change occurred within Google. A high or very high score indicates a high chance that your website’s rankings could significantly fluctuate.
With this information, you can be more aware of the reasoning behind changes in your search rankings across multiple devices—if big changes are a result of your marketing efforts or Google’s algorithm updates.
If you want to receive a notification whenever Sensor notices significant fluctuations in rankings, you can sign up for email or browser push notifications with the blue “subscribe to notifications” button at the top right of the screen.
You can also embed Semrush sensor on your own site by using the embed widget feature. With the embed widget, you can decide which database and device you want to pull data from, as well as the category.
SERP Features
Sensor can also give you insight into the SERP Features presence on results pages. You can measure their occurrence in the top 20 and the difference from the previous day (indicated by red or green percentage). This tells you which specific SERP Features are getting the majority of visibility in Google’s top 20 results. Keep in mind that these percentages will change depending on what category you’re looking at. Certain markets and categories are naturally going to have higher percentages of certain SERP Features.
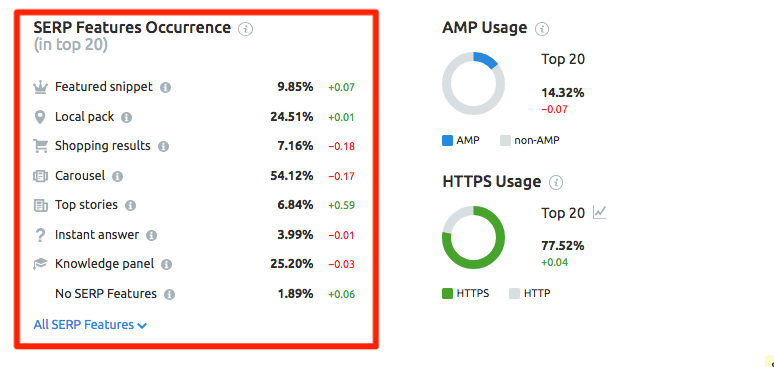
For example, Local Packs are important for categories like Travel, Real Estate, and Home & Garden, but not as important for something like Books & Literature.
If you click on the trend of a SERP Feature occurrence, you will see a pink trend graph showing any spikes or declines in the presence of that SERP Feature in the category you have selected.

Connect your Position Tracking campaign with Sensor to see how SERP Features volatility trends correlate with your website’s rankings for them.
Comparing Categories
The keyword set that we use to calculate the Sensor Score consists of keywords in several different categories and markets. These categories show how different Google updates can impact certain industries more than others. This can be especially helpful if you have a business or website that has a service spanning over multiple categories and markets.
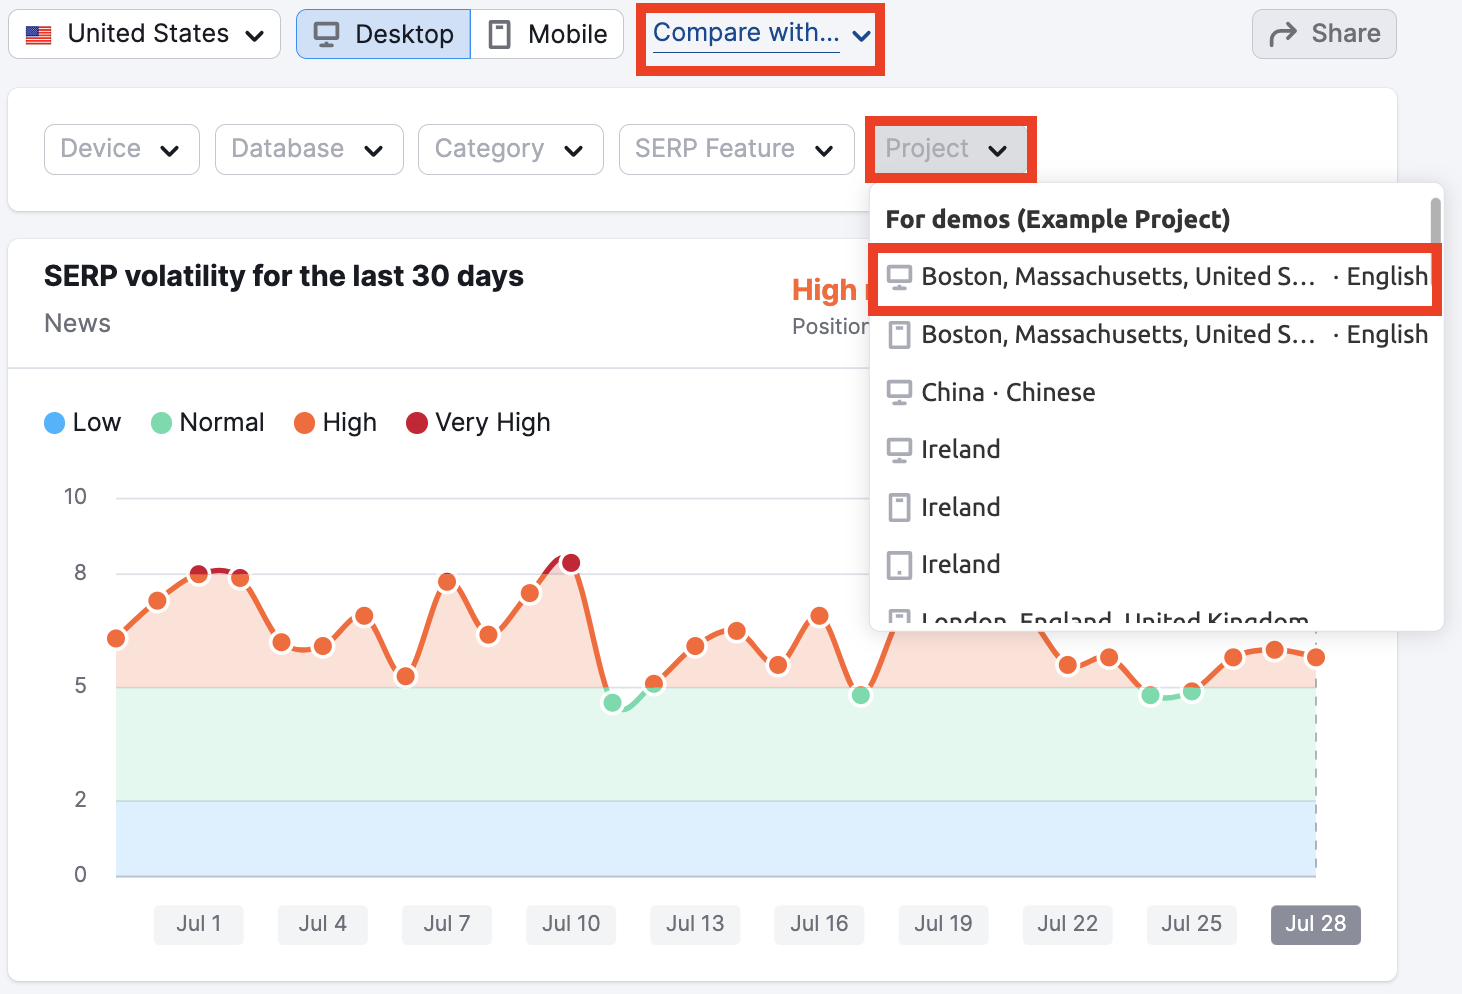
To make visual comparisons, use the “Compare with…” drop-down at the top right of the 30 days graph. This feature will allow you to look at two countries at once, see desktop vs. mobile volatility, compare your project’s volatility to the rest of Google and more.
When you select a category, Sensor will plot out two color-coded lines—one for the selected category and another representing all categories. Take a screenshot and put it in PDF report to show off your industry knowledge to your clients.
If you select SERP Features in the comparison drop down, it will show you how the presence of a specific SERP Feature has grown or diminished alongside Google’s volatility over the past 30 days.
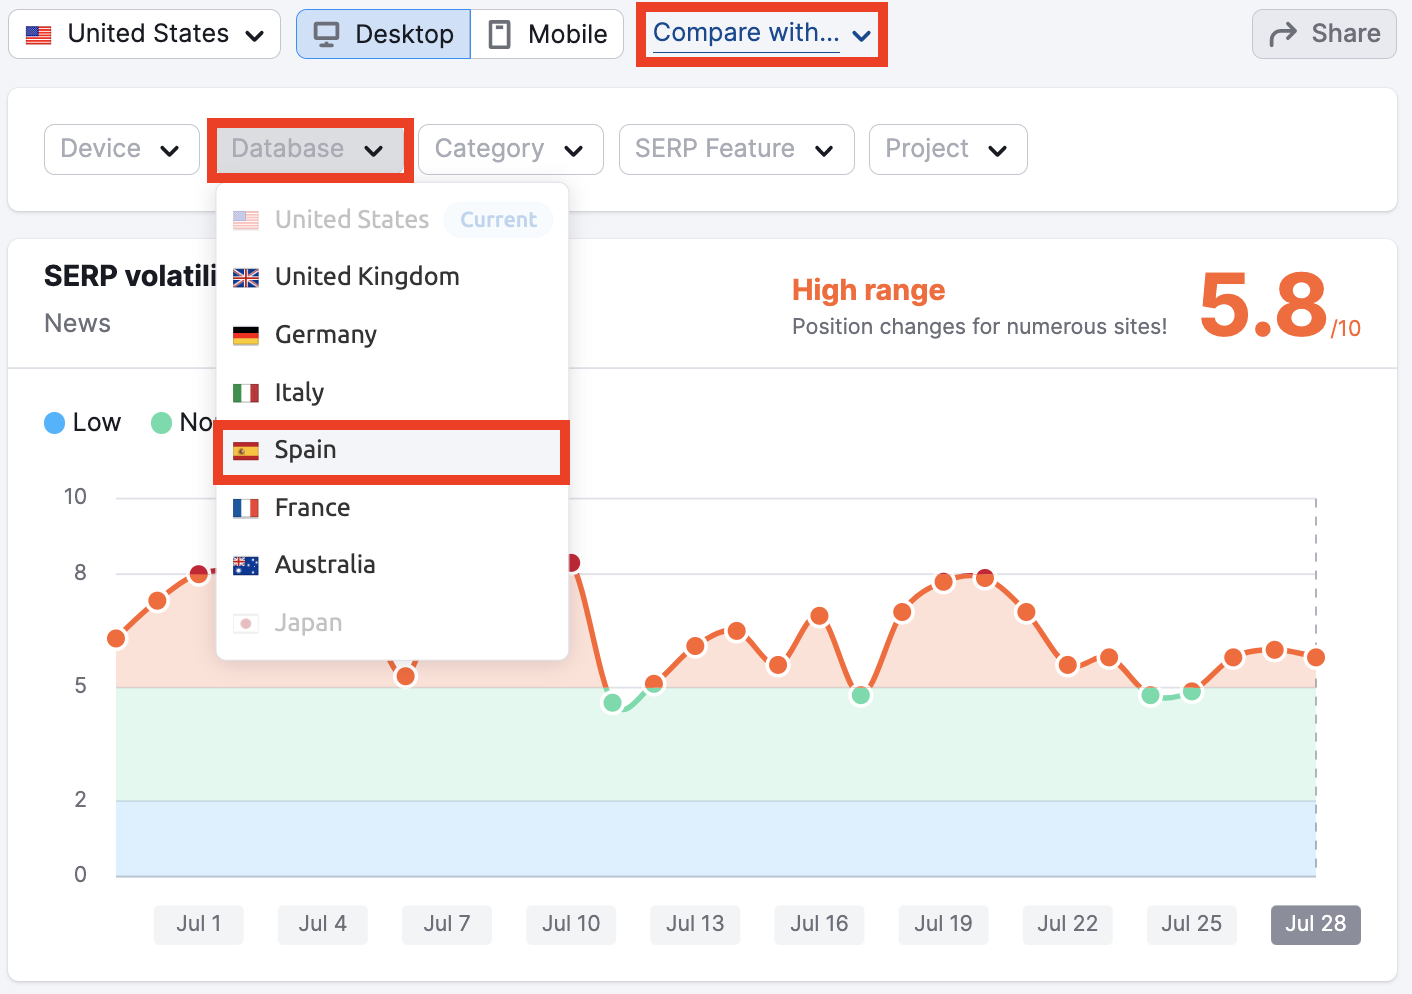
To compare your Project to a database, select your project and targeting from the drop-down. Make sure to select the main database and category that you want to compare your Project too. If you select a category, the dark blue line representing the main database will update to show that category’s volatility. This way, you can compare your project to the industry that it is most relevant to.
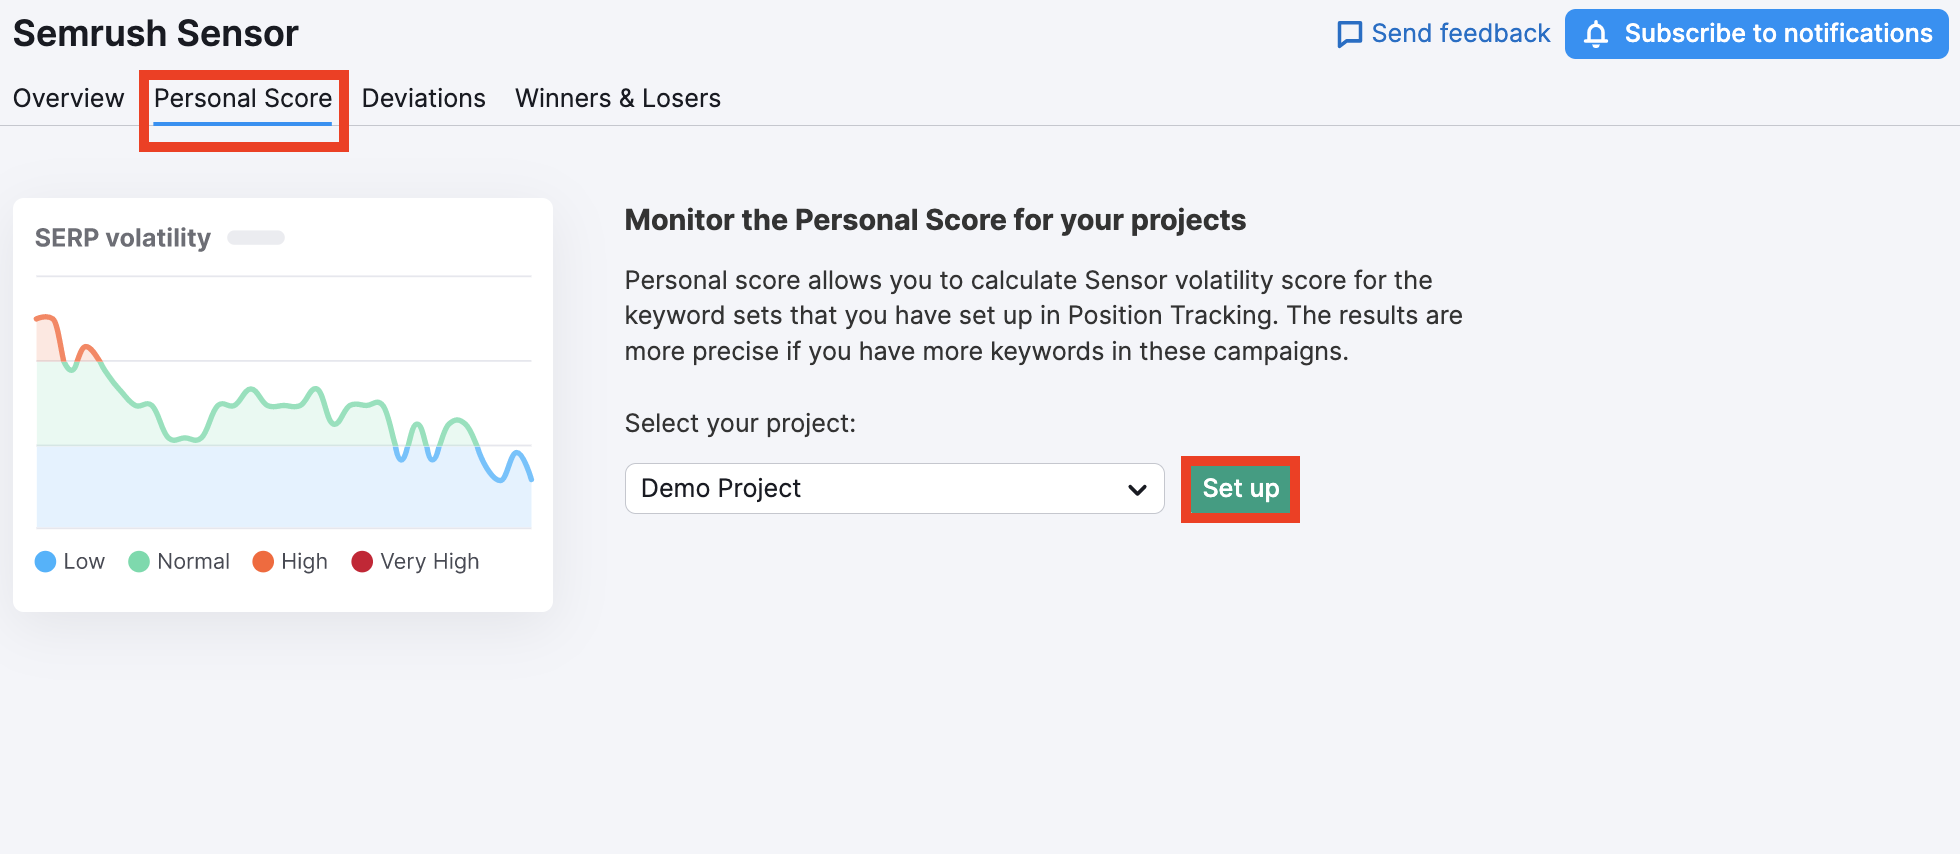
Personal Scores from Position Tracking
The Sensor Score tracks desktop SERPs (and all mobile, excluding China), but also has the ability to measure mobile or tablet results as a “Personal Score” if you set up mobile or tablet targeting with a Position Tracking campaign.
Position Tracking allows you to track the daily SERP positions of a custom set of keywords. Campaigns can be configured to track results in different locations (down to the city level) as well as different devices (mobile, tablet, or desktop) and search engines (Google, Bing, Baidu, and ChatGPT).
To set up your personal score you’ll need to navigate to that tab located directly to the right of the Overview section. Once you’re in the Personal Score tab, find your Projects on the left-hand side and select “Set Up” for your intended project. It will take a few moments but your personal scores will then be ready to review in this tab.
Note: The Personal Score is available only to users with the SEO Toolkit subscription.
Deviations
In the “Deviations” tab, you can look for specific days where volatility was out of the ordinary. The graph measures each day’s deviation compared to the monthly average so you can tell which days in the past month saw the most or least amount of change. It can also help you understand which industries were most impacted by an update.
The average deviation across all categories will be listed first in the list and the categories with the most deviation from the average will be listed next in bold text. Keep in mind that the deviations are all relative to the day that you have selected at the top of the page.
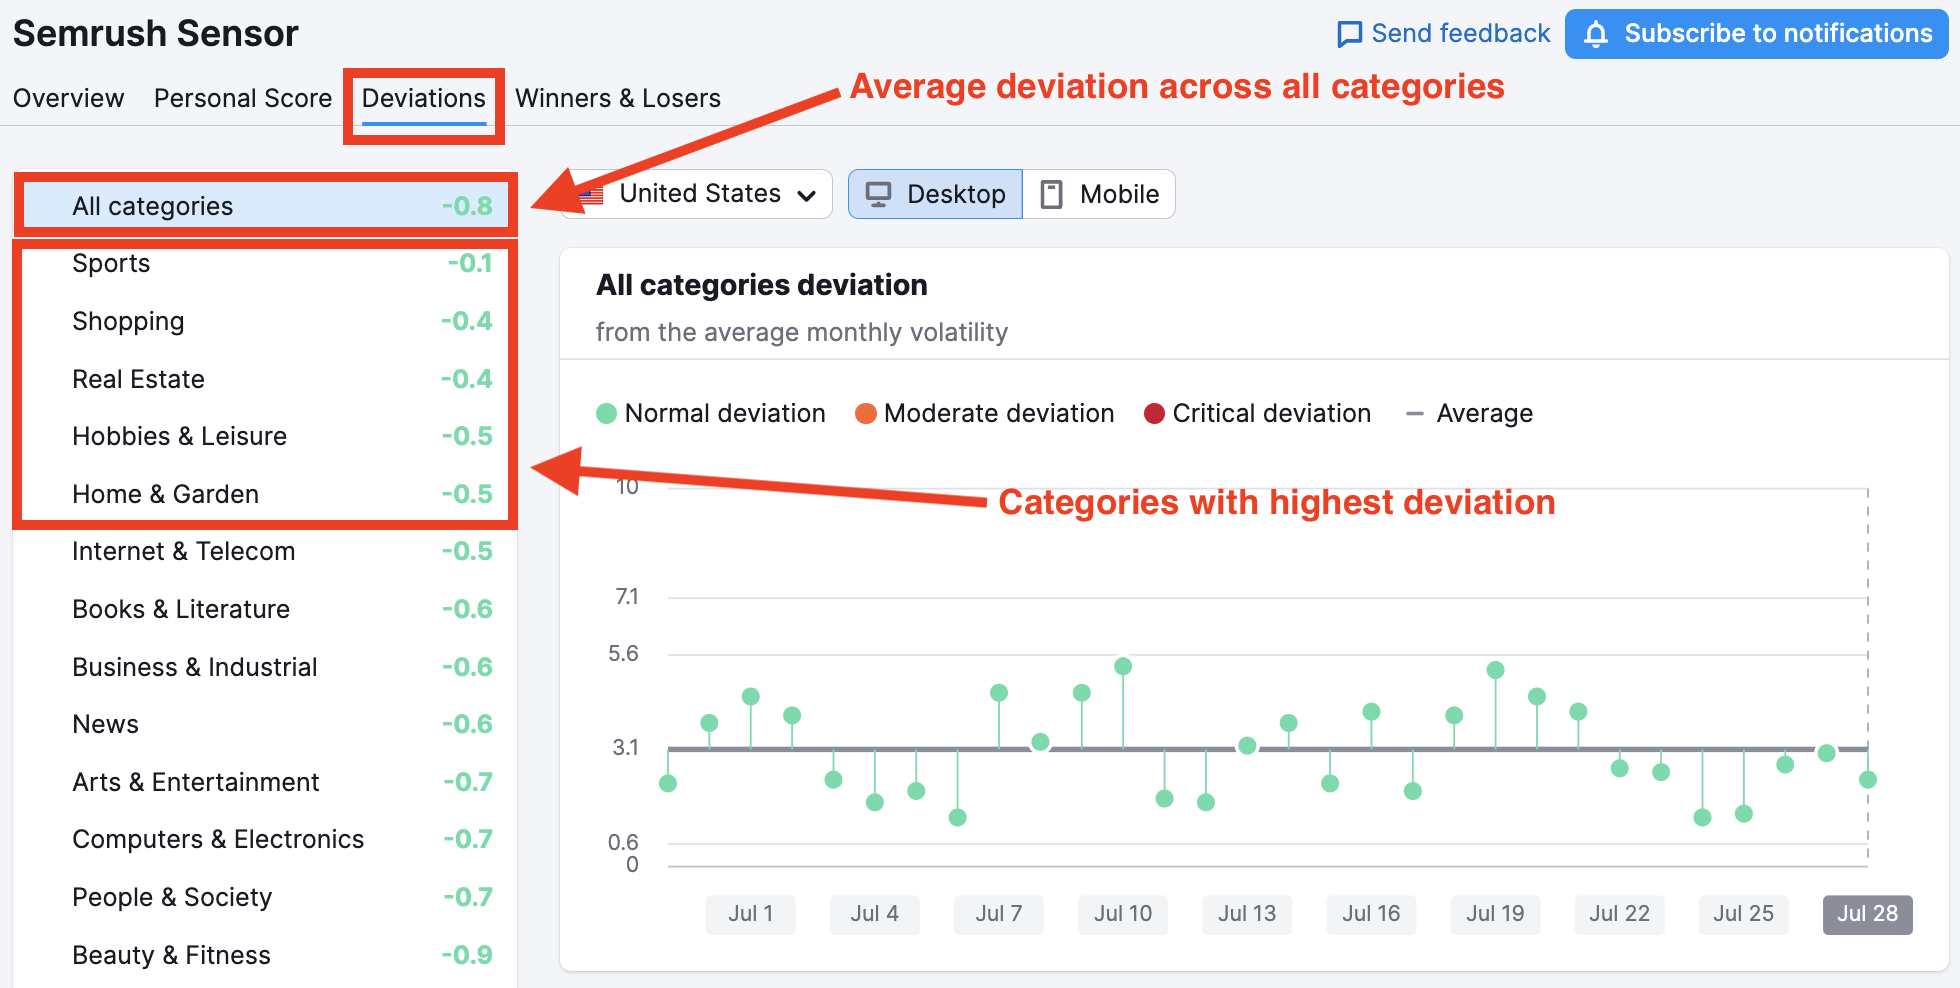
To hone in on a specific industry, you can select the category from the left menu and the graph will show that category’s daily deviation from its average.
Winners and Losers
For every domain that is tracked by Sensor, the average movement of the top 20 URLs is calculated. The Winners and Losers report presents you with the domains most affected on a daily basis. You will be able to see the source domain, the average number of positions gained by that domain over the previous day, the positions trend, the number of keywords tracked for the domain and the number of new keywords.
Keep in mind that since Sensor tracks a limited set of keywords, these metrics are not an absolute across the entire web, but rather just a sample to help you research which domains suffered during a Google update.
International Databases
In addition to the Google US database, Sensor currently offers eight international databases to analyze. These include:
- United Kingdom (Google)
- Germany (Google)
- Italy (Google)
- Spain (Google)
- France (Google)
- Australia (Google)
- Japan (Google)
- China (Baidu)
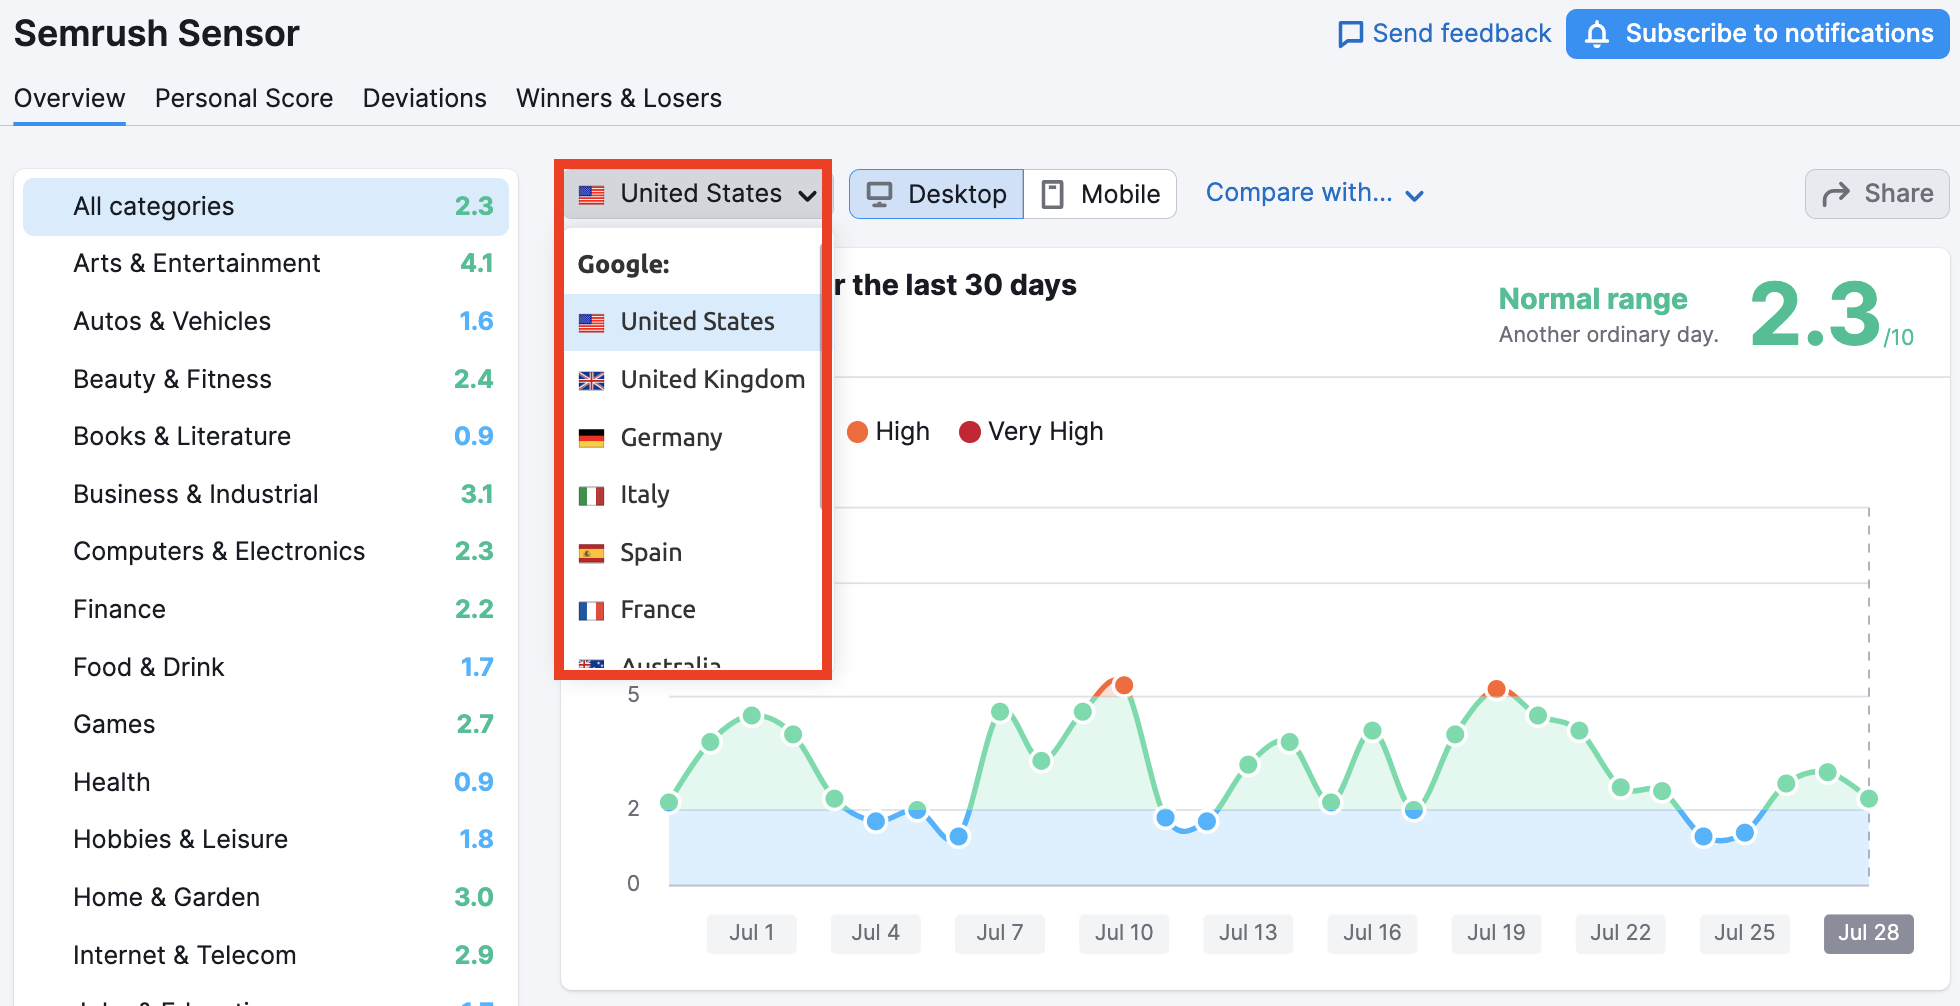
You can change the database with the drop down menu at the top of the page. At the moment, no "category" data is available for the Japanese database but all other features remain available for your research. The China database currently only provides the volatility score and 30-day graph.